Fortrade Canada Ltd. as an order-execution only dealer is not permitted to provide you with any advice or recommendations. These Market Commentaries should not be construed as a recommendation, advice or any attempt by Fortrade Canada Ltd. to prompt or influence you in making an investment decision to purchase, sell, hold or exchange any security or to influence the timing of such activity. This content is produced by Fortrade Limited which is not registered in any capacity with any securities regulatory authority in Canada.
66% of retail investor accounts lose money when trading CFDs with this provider.
CFDs are complex instruments and come with a high risk of losing money rapidly due to leverage. 66% of retail investor accounts lose money when trading CFDs with this provider. You should consider whether you understand how CFDs work and whether you can afford to take the high risk of losing your money.
70.91% of retail investor accounts lose money when trading CFDs with this provider.
CFDs are complex instruments and come with a high risk of losing money rapidly due to leverage. 70.91% of retail investor accounts lose money when trading CFDs with this provider. You should consider whether you understand how CFDs work and whether you can afford to take the high risk of losing all your money. Read full risk warning.
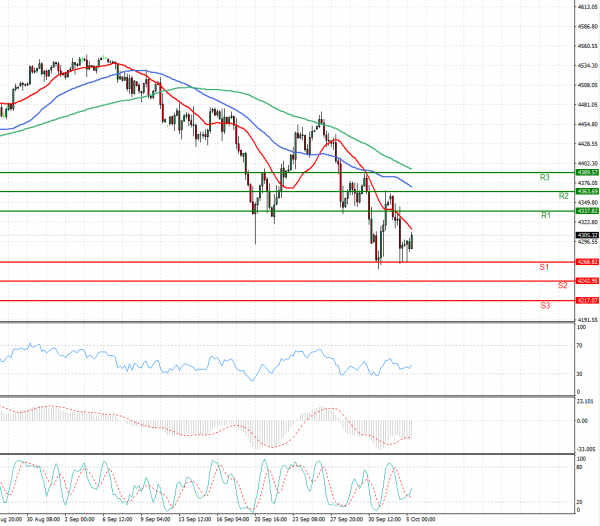
US Session Analysis for CFD Instruments 05/10/2021
Fundamental analysis
05 October, 2021
U.S. stock futures paused, a day after a selloff among some of America’s biggest technology firms dragged down broader indexes, while investors also contended with surging energy prices. Futures tied to the S&P 500 were flat Tuesday, while tech-heavy Nasdaq-100 futures edged up 0.2%, suggesting indexes could recover some of the prior day’s losses. Blue-chip Dow Jones Industrial Average Futures rose 0.1%. Behind a big chunk of the recent declines: losses for some of America’s biggest tech firms. Major tech stocks are especially sensitive to changes in bond yields, which affect the values that investors ascribe to far-off future profits. Those falls took a breather early Tuesday. Facebook shares were up 1.3% in premarket trading, a day after an outage shut down its social media and messaging platforms. Facebook whistleblower Frances Haugen is set to testify before Congress on Tuesday.