Fortrade Canada Ltd. as an order-execution only dealer is not permitted to provide you with any advice or recommendations. These Market Commentaries should not be construed as a recommendation, advice or any attempt by Fortrade Canada Ltd. to prompt or influence you in making an investment decision to purchase, sell, hold or exchange any security or to influence the timing of such activity. This content is produced by Fortrade Limited which is not registered in any capacity with any securities regulatory authority in Canada.
66% of retail investor accounts lose money when trading CFDs with this provider.
CFDs are complex instruments and come with a high risk of losing money rapidly due to leverage. 66% of retail investor accounts lose money when trading CFDs with this provider. You should consider whether you understand how CFDs work and whether you can afford to take the high risk of losing your money.
70.91% of retail investor accounts lose money when trading CFDs with this provider.
CFDs are complex instruments and come with a high risk of losing money rapidly due to leverage. 70.91% of retail investor accounts lose money when trading CFDs with this provider. You should consider whether you understand how CFDs work and whether you can afford to take the high risk of losing all your money. Read full risk warning.
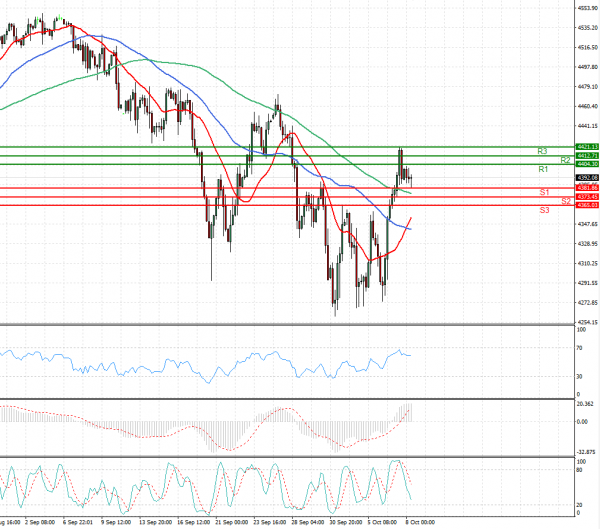
US Session Analysis for CFD Instruments 08/10/2021
Fundamental analysis
08 October, 2021
U.S. stock futures paused ahead of fresh data on job growth that is expected to provide insight into the recovery of the labor market and economy. Futures tied to the S&P 500 were relatively flat, hovering after rising for three straight trading sessions and closing up 0.8% Thursday. Nasdaq-100 futures edged down less than 0.1%, pointing to technology stocks hovering after the previous day’s rally. Stocks are on track for their best weekly performance in six weeks. Volatility returned to markets in recent days, with the S&P 500 swinging at least 1% for three out of four days this week. Investors were focused on surging energy prices, concerns about inflation and negotiations on the U.S. debt ceiling. Lawmakers struck a deal for a short-term extension to the debt limit in the Senate on Thursday, which helped boost market sentiment, investors said.