Fortrade Canada Ltd. as an order-execution only dealer is not permitted to provide you with any advice or recommendations. These Market Commentaries should not be construed as a recommendation, advice or any attempt by Fortrade Canada Ltd. to prompt or influence you in making an investment decision to purchase, sell, hold or exchange any security or to influence the timing of such activity. This content is produced by Fortrade Limited which is not registered in any capacity with any securities regulatory authority in Canada.
66% of retail investor accounts lose money when trading CFDs with this provider.
CFDs are complex instruments and come with a high risk of losing money rapidly due to leverage. 66% of retail investor accounts lose money when trading CFDs with this provider. You should consider whether you understand how CFDs work and whether you can afford to take the high risk of losing your money.
70.91% of retail investor accounts lose money when trading CFDs with this provider.
CFDs are complex instruments and come with a high risk of losing money rapidly due to leverage. 70.91% of retail investor accounts lose money when trading CFDs with this provider. You should consider whether you understand how CFDs work and whether you can afford to take the high risk of losing all your money. Read full risk warning.
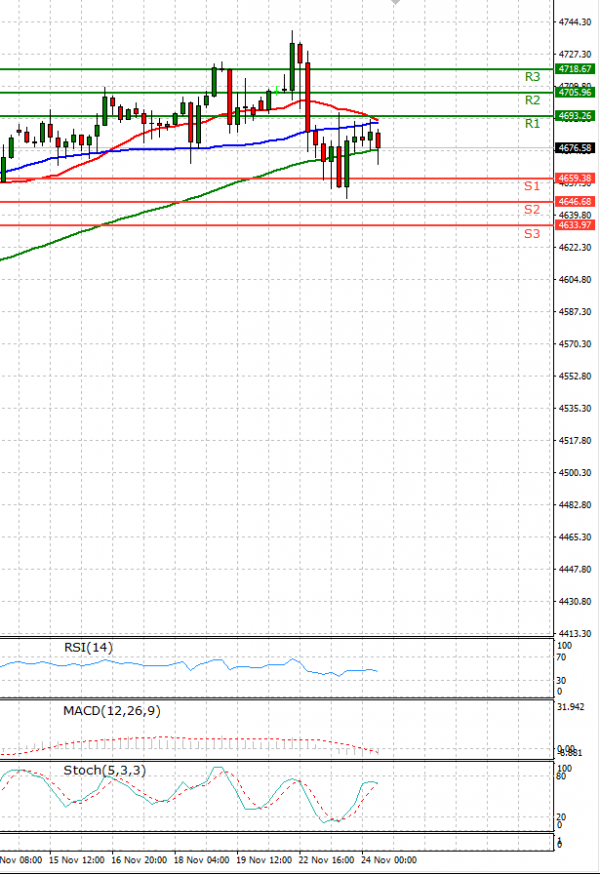
US Session Analysis for CFD Instruments 24/11/2021
Fundamental analysis
24 November, 2021
U.S. stock futures paused as investors awaited a bumper day of economic data releases ahead of the Thanksgiving holiday, plus minutes from the Federal Reserve’s latest meeting. Futures tied to the S&P 500 edged down 0.1% Wednesday, while blue-chip Dow Jones Industrial Average Futures weakened by 0.2%. Technology-heavy Nasdaq-100 futures crept up 0.1%, a day after tech firms were an area of weakness for the stock market, in part due to rising bond yields. Stock markets’ gains have been tempered in recent weeks by concerns over fresh coronavirus lockdowns in parts of the world, and inflation that is proving longer lasting than many had anticipated. The robust earnings season, which had been a major boost to markets, is drawing to a close and investors are looking for fresh drivers.