CFDs are complex instruments and come with a high risk of losing money rapidly due to leverage. 66% of retail investor accounts lose money when trading CFDs with this provider. You should consider whether you understand how CFDs work and whether you can afford to take the high risk of losing your money.
CFDs are complex instruments and come with a high risk of losing money rapidly due to leverage. 73.43% of retail investor accounts lose money when trading CFDs with this provider. You should consider whether you understand how CFDs work and whether you can afford to take the high risk of losing all your money. Read full risk warning.
Sign Up Free
Log in to your account

USA500 Analysis

US Session Analysis for CFD Instruments 11/10/2023

Fundamental analysis

11 October, 2023

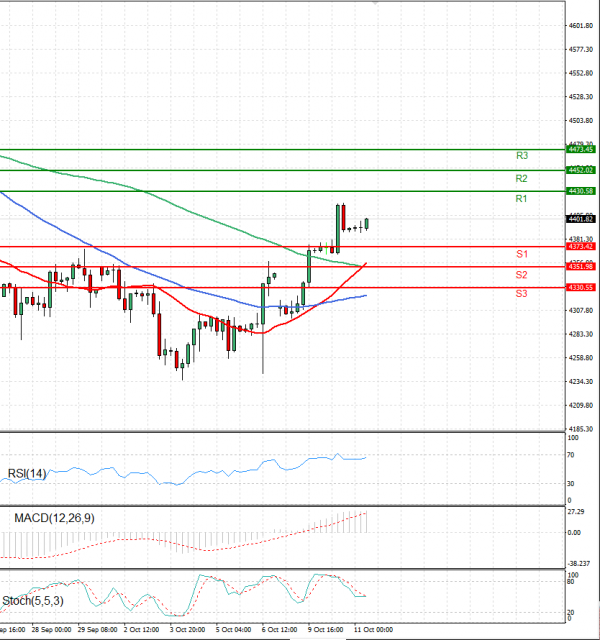
The USA 500 is trading today at 4,365.

The latest rally in U.S. stock futures stalled early Wednesday, as traders eyed a busy few days containing inflation updates and the start of the corporate earnings season.

The S&P 500 has risen 2.35% over the past three trading days as the yield on 10-year Treasuries fell about 20 basis points from their fresh 16-year peak touched on Friday.

The decline in long-term implied borrowing costs comes after recent comments from Federal Reserve officials indicate the central bank may have finished raising interest rates for this cycle.

Technical analysis

USA500 Analysis Technical analysis 11/10/2023
Time Frame: 1 hour

USA500 Support & Resistance Table - 11/10/2023

Support & Resistance Level Explanation
Resistance 2 4452.02 Daily R2
Resistance 1 4430.58 Daily R1
Support 1 4373.42 Daily S1
Support 2 4351.98 Daily S2

USA500 Indicator Table - 11/10/2023

Indicator Signal
SMA 20 Buy
SMA 50 Buy
SMA 100 Buy
MACD( 12;26;9) Buy
RSI (14) Buy
Stochastic ( 9;6;3) Neutral

USA500 Indicator / Period Table - 11/10/2023

Indicator / Period Day - BuyWeek - BuyMonth - Buy
MACD( 12;26;9) Buy BuyBuy
RSI (14) Buy BuyBuy
SMA 20 Buy BuyBuy

USA500 11/10/2023 - Reference Price : 4401.82

Buy
Simple Moving AverageBuy (3)Sell (0)
Technical Indicators - OscillatorsBuy (2)Sell (0)
Share It With Your Network
USA500 Chart
1M 5M H D W
Prices are loading..
Ready for trading?Start Now