77% of retail investor accounts lose money when trading CFDs with this provider.
CFDs are complex instruments and come with a high risk of losing money rapidly due to leverage. 77% of retail investor accounts lose money when trading CFDs with this provider. You should consider whether you understand how CFDs work and whether you can afford to take the high risk of losing your money.
76% of retail investor accounts lose money when trading CFDs with this provider.
CFDs are complex instruments and come with a high risk of losing money rapidly due to leverage. 76% of retail investor accounts lose money when trading CFDs with this provider. You should consider whether you can afford to take the high risk of losing your money.
US Session Analysis for CFD Instruments 25/06/2024
Fundamental analysis
25 June, 2024
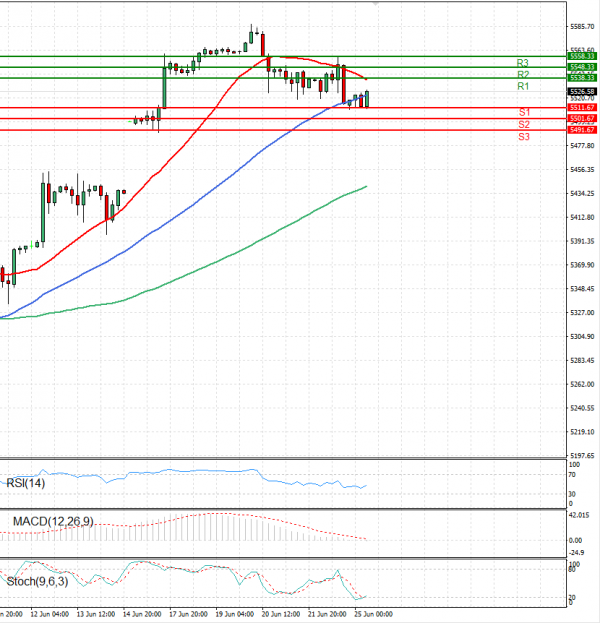
The USA500 is currently trading above 5,520 levels.
U.S. index futures traded mostly higher on Tuesday following yesterday’s session which saw AI linked tech stocks falling and industrial or main street stocks rising. Nvidia was also rising, the chip maker looks to be reversing after a three-day slide that wiped off hundreds of billions from its market valuation.