Fortrade Canada Ltd. as an order-execution only dealer is not permitted to provide you with any advice or recommendations. These Market Commentaries should not be construed as a recommendation, advice or any attempt by Fortrade Canada Ltd. to prompt or influence you in making an investment decision to purchase, sell, hold or exchange any security or to influence the timing of such activity. This content is produced by Fortrade Limited which is not registered in any capacity with any securities regulatory authority in Canada.
66% of retail investor accounts lose money when trading CFDs with this provider.
CFDs are complex instruments and come with a high risk of losing money rapidly due to leverage. 66% of retail investor accounts lose money when trading CFDs with this provider. You should consider whether you understand how CFDs work and whether you can afford to take the high risk of losing your money.
70.91% of retail investor accounts lose money when trading CFDs with this provider.
CFDs are complex instruments and come with a high risk of losing money rapidly due to leverage. 70.91% of retail investor accounts lose money when trading CFDs with this provider. You should consider whether you understand how CFDs work and whether you can afford to take the high risk of losing all your money. Read full risk warning.
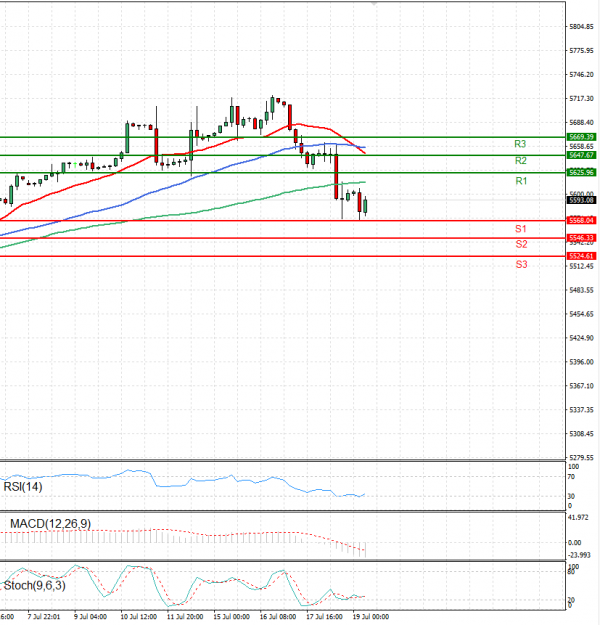
US Session Analysis for CFD Instruments 19/07/2024
Fundamental analysis
19 July, 2024
The USA500 is currently trading above 5,550 levels.
U.S. stock futures were trading lower on Friday amid reports of a global glitch negatively affecting business which has seen flights being cancelled in Europe, delays at airports and the temporary closure of banks and some retailers. The bug affected businesses dependent on certain windows devices with cybersecurity company crowdstrike saying they are urgently working on a fix. Microsoft stock fell almost 2% in premarket trading,
The Dow futures contract was down by 0.30%, S&P 500 futures decreased by 0.1%, and the Nasdaq 100 futures fell by 0.3%.