CFDs are complex instruments and come with a high risk of losing money rapidly due to leverage. 73% of retail investor accounts lose money when trading CFDs with this provider. You should consider whether you understand how CFDs work and whether you can afford to take the high risk of losing your money.
CFDs are complex instruments and come with a high risk of losing money rapidly due to leverage. 76% of retail investor accounts lose money when trading CFDs with this provider. You should consider whether you can afford to take the high risk of losing your money.

USA500 Analysis

US Session Analysis for CFD Instruments 06/09/2024

Fundamental analysis

06 September, 2024

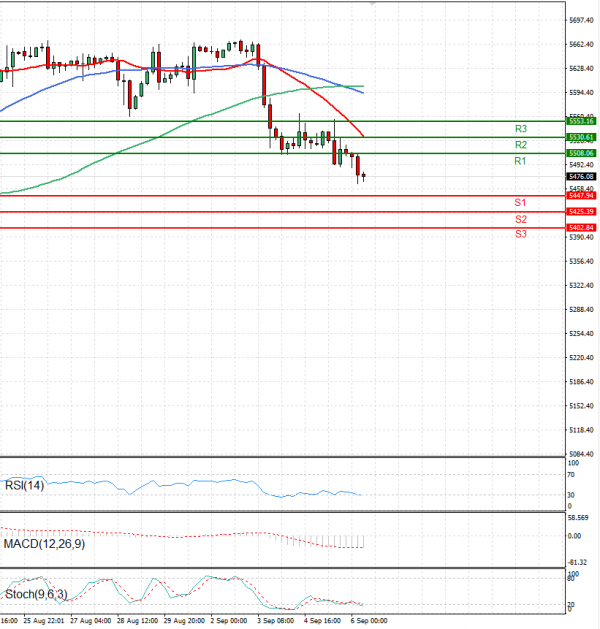
The USA500 is currently trading below 5,500 levels.

USA500 stock futures fell lower on Friday, as investors awaited a much-awaited labor market report that could factor into the Federal Reserve's next monetary policy decision. NFP figures are expected to show that 164,000 were added over the previous month.

The Dow futures contract decreased by 0.3%, S&P 500 futures were down by 0.6%, and the Nasdaq 100 futures fell by 1.1%.

Technical analysis

USA500 Analysis Technical analysis 06/09/2024
Time Frame: 1 hour

USA500 Support & Resistance Table - 06/09/2024

Support & Resistance Level Explanation
Resistance 2 5530.61 Daily R2
Resistance 1 5508.06 Daily R1
Support 1 5447.94 Daily S1
Support 2 5425.39 Daily S2

USA500 Indicator Table - 06/09/2024

Indicator Signal
SMA 20 Sell
SMA 50 Sell
SMA 100 Sell
MACD( 12;26;9) Sell
RSI (14) Sell
Stochastic ( 9;6;3) Sell

USA500 Indicator / Period Table - 06/09/2024

Indicator / Period Day - SellWeek - BuyMonth - Buy
MACD( 12;26;9) Sell BuyBuy
RSI (14) Sell BuyBuy
SMA 20 Sell BuyBuy

USA500 06/09/2024 - Reference Price : 5476.08

Sell
Simple Moving AverageBuy (0)Sell (3)
Technical Indicators - OscillatorsBuy (0)Sell (3)
Share It With Your Network
USA500 Chart
Update Time: -
Highest
Lowest
1M 5M H D W
Prices are loading..
Ready for trading?Start Now