CFDs are complex instruments and come with a high risk of losing money rapidly due to leverage. 73% of retail investor accounts lose money when trading CFDs with this provider. You should consider whether you understand how CFDs work and whether you can afford to take the high risk of losing your money.
CFDs are complex instruments and come with a high risk of losing money rapidly due to leverage. 75% of retail investor accounts lose money when trading CFDs with this provider. You should consider whether you can afford to take the high risk of losing your money.

USA500 Analysis

US Session Analysis for CFD Instruments 15/10/2024

Fundamental analysis

15 October, 2024

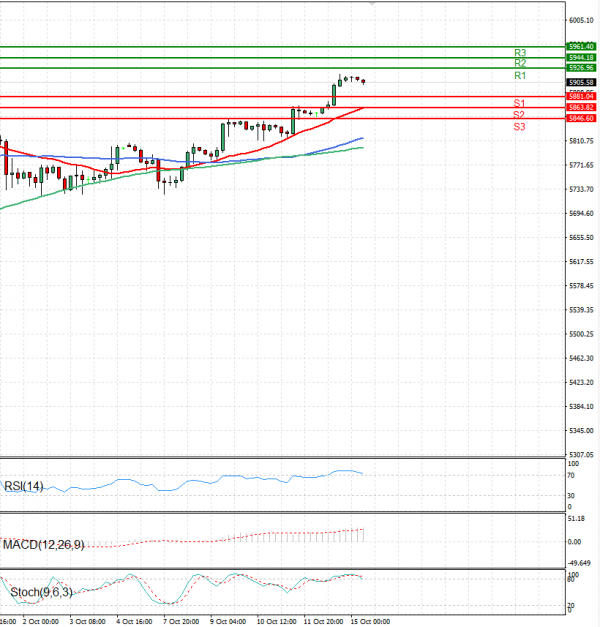
The USA500 is currently trading above 5,900 levels.

US stock futures mostly edged higher around both sides of the flatline as markets waited for cues from fresh company earnings and economic indicators.

The Dow futures contract climbed by 0.15%, S&P 500 futures were up by 0.01%, and the Nasdaq 100 decreased by 0.14%.

Technical analysis

USA500 Analysis Technical analysis 15/10/2024
Time Frame: 1 hour

USA500 Support & Resistance Table - 15/10/2024

Support & Resistance Level Explanation
Resistance 2 5944.18 Daily R2
Resistance 1 5926.96 Daily R1
Support 1 5881.04 Daily S1
Support 2 5963.82 Daily S2

USA500 Indicator Table - 15/10/2024

Indicator Signal
SMA 20 Buy
SMA 50 Buy
SMA 100 Buy
MACD( 12;26;9) Buy
RSI (14) Sell
Stochastic ( 9;6;3) Sell

USA500 Indicator / Period Table - 15/10/2024

Indicator / Period Day - BuyWeek - BuyMonth - Buy
MACD( 12;26;9) Buy BuyBuy
RSI (14) Sell BuyBuy
SMA 20 Buy BuyBuy

USA500 15/10/2024 - Reference Price : 5905.58

Buy
Simple Moving AverageBuy (3)Sell (0)
Technical Indicators - OscillatorsBuy (1)Sell (2)
Share It With Your Network
USA500 Chart
Update Time: -
Highest
Lowest
1M 5M H D W
Prices are loading..
Ready for trading?Start Now