Fortrade Canada Ltd. as an order-execution only dealer is not permitted to provide you with any advice or recommendations. These Market Commentaries should not be construed as a recommendation, advice or any attempt by Fortrade Canada Ltd. to prompt or influence you in making an investment decision to purchase, sell, hold or exchange any security or to influence the timing of such activity. This content is produced by Fortrade Limited which is not registered in any capacity with any securities regulatory authority in Canada.
66% of retail investor accounts lose money when trading CFDs with this provider.
CFDs are complex instruments and come with a high risk of losing money rapidly due to leverage. 66% of retail investor accounts lose money when trading CFDs with this provider. You should consider whether you understand how CFDs work and whether you can afford to take the high risk of losing your money.
70.91% of retail investor accounts lose money when trading CFDs with this provider.
CFDs are complex instruments and come with a high risk of losing money rapidly due to leverage. 70.91% of retail investor accounts lose money when trading CFDs with this provider. You should consider whether you understand how CFDs work and whether you can afford to take the high risk of losing all your money. Read full risk warning.
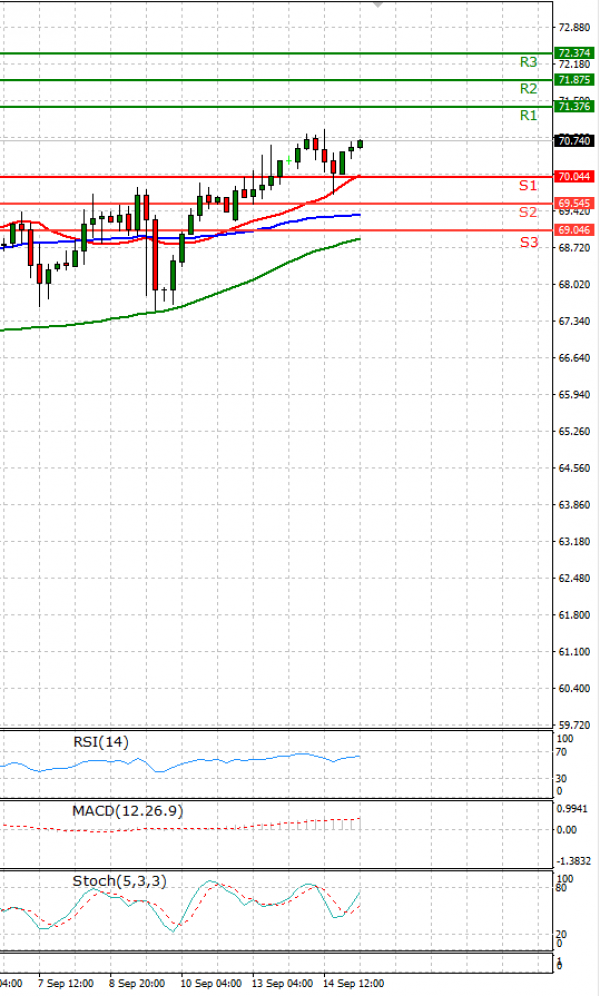
EU Session Analysis for CFD Instruments 16/09/2021
Fundamental analysis
16 September, 2021
Oil prices climbed on Thursday, extending the previous day's solid gains after a larger-than-expected drawdown in crude oil stocks in the United States, the world's largest oil consumer. U.S. crude oil and fuel stockpiles dropped sharply last week, as refiners in the U.S. Gulf region and oil facilities offshore were still recovering from Hurricane Ida, the Energy Information Administration (EIA) said on Wednesday. Crude inventories fell by 6.4 million barrels in the week to Sept. 10 to 417.4 million barrels, the EIA said, compared with expectations in a Reuters poll for a 3.5 million-barrel drop.