Fortrade Canada Ltd. as an order-execution only dealer is not permitted to provide you with any advice or recommendations. These Market Commentaries should not be construed as a recommendation, advice or any attempt by Fortrade Canada Ltd. to prompt or influence you in making an investment decision to purchase, sell, hold or exchange any security or to influence the timing of such activity. This content is produced by Fortrade Limited which is not registered in any capacity with any securities regulatory authority in Canada.
66% of retail investor accounts lose money when trading CFDs with this provider.
CFDs are complex instruments and come with a high risk of losing money rapidly due to leverage. 66% of retail investor accounts lose money when trading CFDs with this provider. You should consider whether you understand how CFDs work and whether you can afford to take the high risk of losing your money.
70.91% of retail investor accounts lose money when trading CFDs with this provider.
CFDs are complex instruments and come with a high risk of losing money rapidly due to leverage. 70.91% of retail investor accounts lose money when trading CFDs with this provider. You should consider whether you understand how CFDs work and whether you can afford to take the high risk of losing all your money. Read full risk warning.
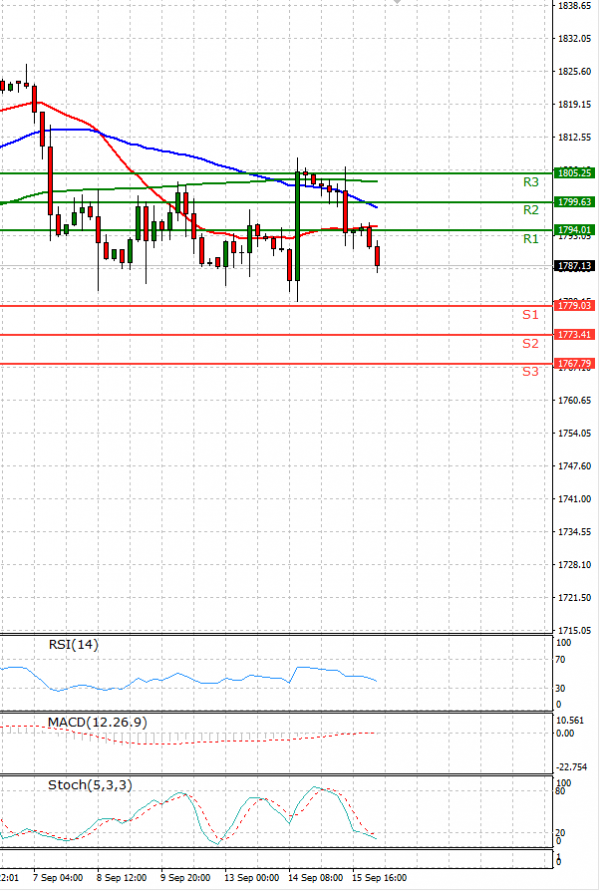
EU Session Analysis for CFD Instruments 16/09/2021
Fundamental analysis
16 September, 2021
Gold prices inched lower on Thursday as cautious investors awaited signals on the U.S. Federal Reserve’s timeline on withdrawal of its pandemic-era stimulus, with analysts expecting a further slide in prices on a formal announcement.Bullion is viewed as a hedge against the inflation and currency debasement likely from widespread stimulus. The Fed’s tapering could tackle both those conditions, diminishing gold’s appeal. The Federal Open Market Committee’s two-day policy meeting is due on Sept. 21-22, where the U.S. central bank is expected to provide guidance on when it will start withdrawing its asset purchases and on eventual interest rate hike.