CFDs are complex instruments and come with a high risk of losing money rapidly due to leverage. 66% of retail investor accounts lose money when trading CFDs with this provider. You should consider whether you understand how CFDs work and whether you can afford to take the high risk of losing your money.
CFDs are complex instruments and come with a high risk of losing money rapidly due to leverage. 70.91% of retail investor accounts lose money when trading CFDs with this provider. You should consider whether you understand how CFDs work and whether you can afford to take the high risk of losing all your money. Read full risk warning.

Gold - Usd Dollar Analysis

EU Session Analysis for CFD Instruments 18/10/2023

Fundamental analysis

18 October, 2023

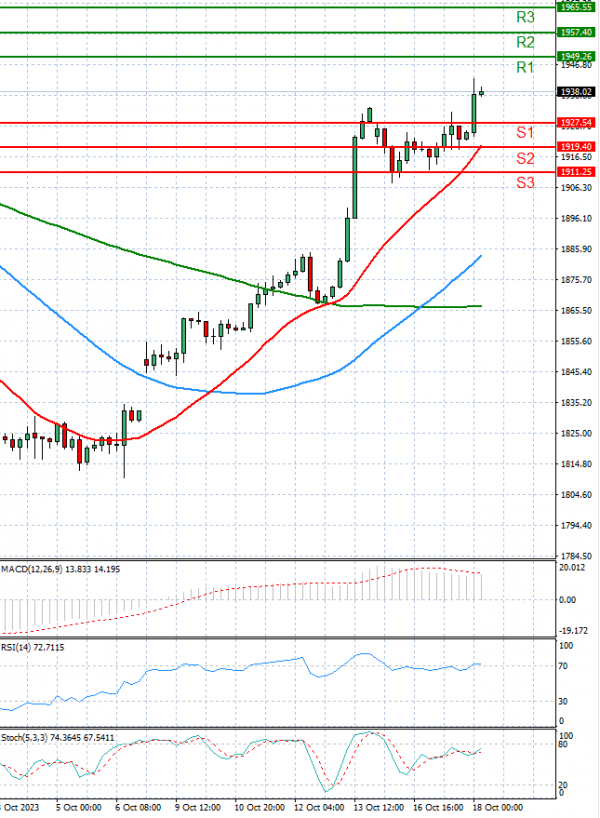
Gold spot price is trading lower today at 1938.3

Gold prices witnessed sharp gains in the morning trade in the domestic futures market on Wednesday, October 18, mirroring positive trends in global markets, amid concerns over an escalation in the Israel-Hamas war.

Gold is often considered a safe-haven asset in times of geopolitical turmoil, economic uncertainty, or financial market instability.

Technical analysis

Gold - Usd Dollar Analysis Technical analysis 18/10/2023
Time Frame: 1 hour

GOLD Support & Resistance Table - 18/10/2023

Support & Resistance Level Explanation
Resistance 2 1957.40 Daily R2
Resistance 1 1949.26 Daily R1
Support 1 1927.54 Daily S1
Support 2 1919.40 Daily S2

GOLD Indicator Table - 18/10/2023

Indicator Signal
SMA 20 Buy
SMA 50 Buy
SMA 100 Buy
MACD( 12;26;9) Buy
RSI (14) Buy
Stochastic ( 9;6;3) Buy

GOLD Indicator / Period Table - 18/10/2023

Indicator / Period Day - BuyWeek - BuyMonth - Buy
MACD( 12;26;9) Buy SellNeutral
RSI (14) Buy BuyBuy
SMA 20 Buy BuyBuy

GOLD 18/10/2023 - Reference Price : 1938.40

Buy
Simple Moving AverageBuy (3)Sell (0)
Technical Indicators - OscillatorsBuy (3)Sell (0)
Share It With Your Network
GOLD Chart
Update Time: -
Highest
Lowest
1M 5M H D W
Prices are loading..
Ready for trading?Start Now