CFDs are complex instruments and come with a high risk of losing money rapidly due to leverage. 66% of retail investor accounts lose money when trading CFDs with this provider. You should consider whether you understand how CFDs work and whether you can afford to take the high risk of losing your money.
CFDs are complex instruments and come with a high risk of losing money rapidly due to leverage. 70.91% of retail investor accounts lose money when trading CFDs with this provider. You should consider whether you understand how CFDs work and whether you can afford to take the high risk of losing all your money. Read full risk warning.

USA500 Analysis

EU Session Analysis for CFD Instruments 09/11/2021

Fundamental analysis

09 November, 2021

Wall Street stocks ended slightly higher on Monday, gaining early in the day as investors cheered passage of a U.S. infrastructure spending bill, but paring gains late as sliding Tesla shares weighed the indexes down. Tesla Inc was the heaviest weight on the S&P 500. Its shares fell following CEO Elon Musk’s Twitter poll on whether he should sell about 10% of his holdings of stock in the electric automaker company he founded. The poll garnered more than 3.5 million votes, with 57.9% voting “Yes”. Lawmakers now turn to Biden’s social spending bill, with the House of Representatives expected to vote on the measure next week, according to White House economic adviser Brian Deese. The third-quarter reporting season has reached the final stretch, with 445 of the companies in the S&P 500 having reported as of Friday. Of those, 81% have come in above analyst expectations, according to Refinitiv. Cryptocurrency and blockchain-related stocks, including those of Coinbase Global, Riot Blockchain, Marathon Digital Holdings and MicroStrategy Inc rose sharply, as ether scaled new peaks and bitcoin neared a record high.
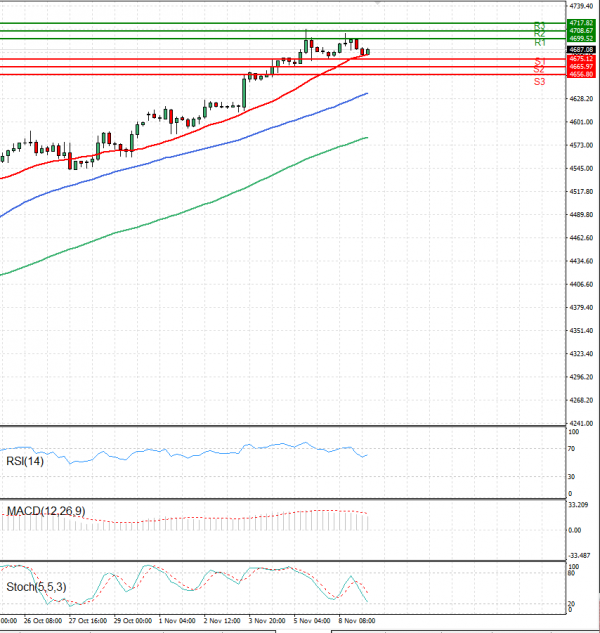
Technical analysis

USA500 Analysis Technical analysis 09/11/2021
Time Frame: 1 hour

USA500 Support & Resistance Table - 09/11/2021

Support & Resistance Level Explanation
Resistance 2 4708.67 Daily R2
Resistance 1 4699.52 Daily R1
Support 1 4675.12 Daily S1
Support 2 4655.97 Daily S2

USA500 Indicator Table - 09/11/2021

Indicator Signal
SMA 20 Buy
SMA 50 Buy
SMA 100 Buy
MACD( 12;26;9) Buy
RSI (14) Buy
Stochastic ( 9;6;3) Sell

USA500 Indicator / Period Table - 09/11/2021

Indicator / Period Day - BuyWeek - BuyMonth - Buy
MACD( 12;26;9) Buy BuyBuy
RSI (14) Buy BuyBuy
SMA 20 Buy BuyBuy

USA500 09/11/2021 - Reference Price : 4687.08

Buy
Simple Moving AverageBuy (3)Sell (0)
Technical Indicators - OscillatorsBuy (2)Sell (1)
Share It With Your Network
USA500 Chart
Update Time: -
Highest
Lowest
1M 5M H D W
Prices are loading..
Ready for trading?Start Now