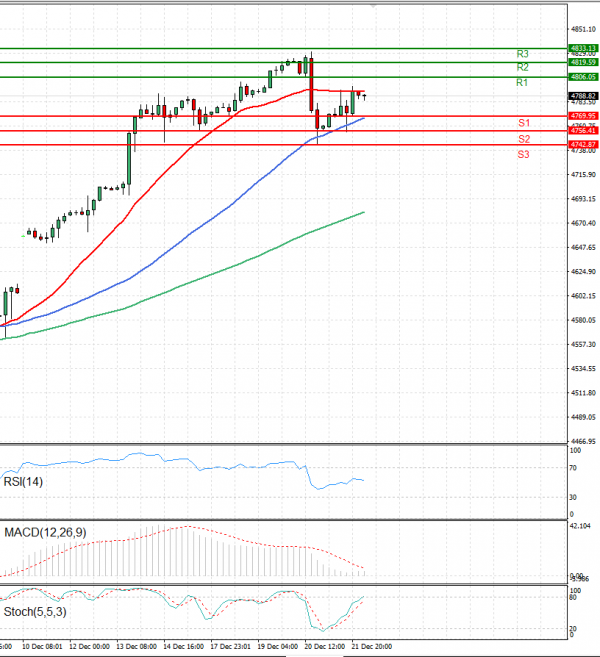
The USA500 is trading at 4,741.
Wall Street, on Thursday, saw a buoyant revival as stocks resumed their upward trajectory. This surge was fueled by optimistic market sentiments due to easing inflation and a shift in central bank policies. It marked a robust recovery from Wednesday's brief downturn. All the three principal indices rose roughly one per cent.
The Dow Jones Industrial Average ended the day with a 0.9 percent upswing, standing at 37,404.35. The broader S&P 500 climbed 1 per cent, reaching 4,746.75, while the tech-centric Nasdaq Composite Index jumped by 1.3 per cent, settling at 14,963.87.
USA500 Analysis
EU Session Analysis for CFD Instruments 22/12/2023
Technical analysis

Time Frame: 1 hour
USA500 Support & Resistance Table - 22/12/2023
| Support & Resistance | Level | Explanation |
| Resistance 2 | 4819.59 | Daily R2 |
| Resistance 1 | 4806.05 | Daily R1 |
| Support 1 | 4769.95 | Daily S1 |
| Support 2 | 4756.41 | Daily S2 |
USA500 Indicator Table - 22/12/2023
| Indicator | Signal |
| SMA 20 | Sell |
| SMA 50 | Buy |
| SMA 100 | Buy |
| MACD( 12;26;9) | Buy |
| RSI (14) | Neutral |
| Stochastic ( 9;6;3) | Buy |
USA500 Indicator / Period Table - 22/12/2023
| Indicator / Period | Day - Buy | Week - Buy | Month - Buy |
| MACD( 12;26;9) | Buy | Buy | Buy |
| RSI (14) | Neutral | Buy | Buy |
| SMA 20 | Sell | Buy | Buy |
USA500 22/12/2023 - Reference Price : 4788.82
| Buy |
|
Ready for trading?Start Now