CFDs are complex instruments and come with a high risk of losing money rapidly due to leverage. 66% of retail investor accounts lose money when trading CFDs with this provider. You should consider whether you understand how CFDs work and whether you can afford to take the high risk of losing your money.
CFDs are complex instruments and come with a high risk of losing money rapidly due to leverage. 73.43% of retail investor accounts lose money when trading CFDs with this provider. You should consider whether you understand how CFDs work and whether you can afford to take the high risk of losing all your money. Read full risk warning.

USA500 Analysis

EU Session Analysis for CFD Instruments 21/06/2024

Fundamental analysis

21 June, 2024

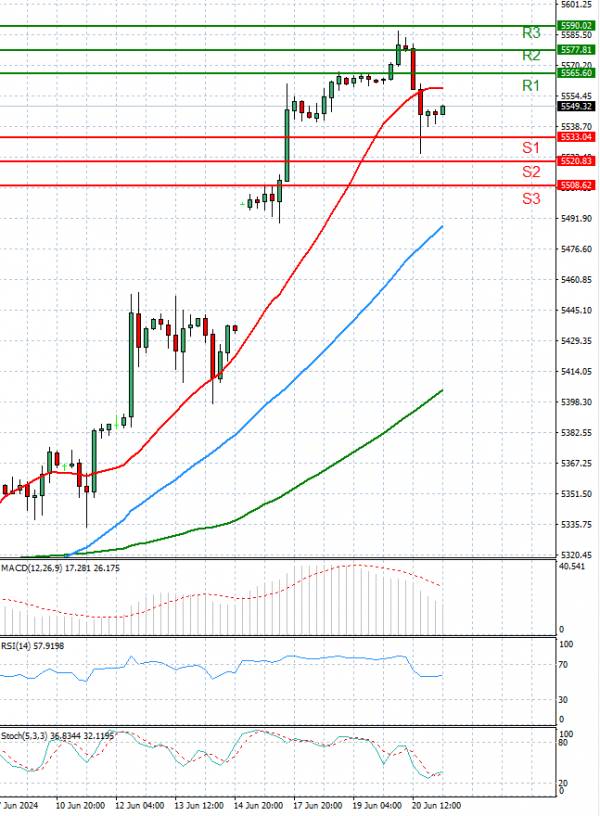
The USA500 is currently trading above 5,400 levels.

The S&P 500 closed lower after briefly surpassing the 5,500 milestone for the first time ever. Nvidia's cooling rally dragged the broader tech sector down, and a flurry of economic data indicated signs of a weaker economy.

The S&P 500 fell 0.2% after hitting an all-time high. The NASDAQ Composite lost 0.8%, while the Dow Jones Industrial Average rose by 0.7%.

Technical analysis

USA500 Analysis Technical analysis 21/06/2024
Time Frame: 1 hour

USA500 Support & Resistance Table - 21/06/2024

Support & Resistance Level Explanation
Resistance 2 5577.81 Daily R2
Resistance 1 5565.60 Daily R1
Support 1 5533.04 Daily S1
Support 2 5520.83 Daily S2

USA500 Indicator Table - 21/06/2024

Indicator Signal
SMA 20 Sell
SMA 50 Buy
SMA 100 Buy
MACD( 12;26;9) Buy
RSI (14) Buy
Stochastic ( 9;6;3) Buy

USA500 Indicator / Period Table - 21/06/2024

Indicator / Period Day - BuyWeek - BuyMonth - Buy
MACD( 12;26;9) Buy BuyBuy
RSI (14) Buy BuyBuy
SMA 20 Sell BuyBuy

USA500 21/06/2024 - Reference Price : 5549.32

Buy
Simple Moving AverageBuy (2)Sell (1)
Technical Indicators - OscillatorsBuy (2)Sell (1)
Share It With Your Network
USA500 Chart
Update Time: -
Highest
Lowest
1M 5M H D W
Prices are loading..
Ready for trading?Start Now