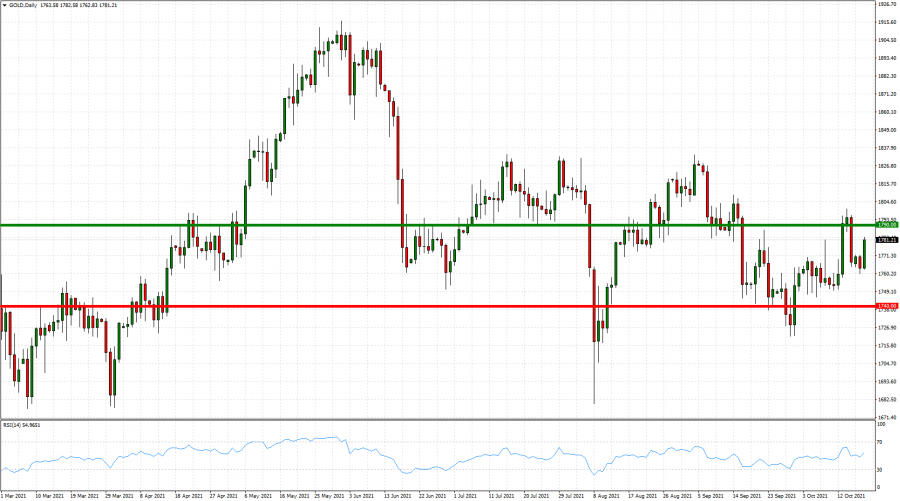
TREND: Channel Trading (1740-1790)
OVERVIEW:
- GOLD PRICE ACTION: Gold has been trading below the mark of 1800 since September 15. Gold, however, stays above the mark of 1740, and every attempt to break below that rate since February 2021 has been welcomed as a quick price recovery opportunity. The channel shows that once Gold hits levels above 1790, it tends to pull back below the mark of 1790. And vice versa, when Gold breaks below 1740, it tries to recover towards the area between 1765 and 1790.
THE CASE OF PRICES GOING DOWN:
- US FEDERAL RESERVE (START OF THE STIMULUS TAPERING): Fed Chair Jerome Powell said on September 23 that it would be appropriate to start tapering their bond purchasing program of 120 billion dollars per month later this year, on condition if decent employment market data has been received September and October.
- INFLATION RISE FAR BEYOND CURRENT LEVELS: If US Inflation (currently at 5.4%) continue to rise to level beyond 6% and towards 7%, then Fed could be urged to quickly act and reduce stimulus program immediately. This could have negative impact on the Gold prices.
THE CASE OF PRICES GOING UP:
- US FEDERAL RESERVE (PROLONGED START OF THE STIMULUS TAPERING): If economic data starts to print worse than expected, then Fed policy makers might be moved to prolong the tapering of the bond purchasing program worth 120 billion dollars per month currently. Or, if they really decide to go with the tapering, then they can do that at much slower pace, meaning that in the meantime they will be still printing money. This could be positive for Gold.
EVENT: US FEDERAL RESERVE MEETING (November 3 at 19:00 GMT+1). The US Fed will meet next on November 3, and if positive data released, the start of the tapering could be announced (Negative for Gold). Otherwise, a delay could be announced, which could be positive for Gold.

Graph: GOLD, Daily
Current Price: 1781
|
GOLD |
Weekly |
|
Resistance |
1790 |
|
Support |
1740 |
Example of calculation based on UPTREND ($1790) direction for 1.00 Lot*
|
Resistance |
Support |
|
|
Profit or loss in $ |
900.00 |
-4,100.00 |
|
Profit or loss in €** |
772.30 |
-3,518.26 |
|
Profit or loss in £** |
653.07 |
-2,975.11 |
|
Profit or loss in C$** |
1,109.04 |
-5,052.31 |
Example of calculation based on DOWNTREND ($1740) direction for 1.00 Lot*
|
Resistance |
Support |
|
|
Profit or loss in $ |
-900.00 |
4,100.00 |
|
Profit or loss in €** |
-772.30 |
3,518.26 |
|
Profit or loss in £** |
-653.07 |
2,975.11 |
|
Profit or loss in C$** |
-1,109.04 |
5,052.31 |
* 1.00 lot is equivalent of 100 units
** Calculations for exchange rate used as of 09:00 a.m. (GMT+1) 19/10/2021
Fortrade recommends the use of Stop-Loss and Take-Profit, please speak to your Client Manager regarding their use.
*** You may wish to consider closing your position in profit, even if it is lower than suggested one
**** Trailing stop technique can protect the profit – Ask your Client Manager for more details