USD/CAD weekly special report based on 1 Lot Calculation:
CANADA:
- EVENT (TUESDAY, JULY 16 AT 13:30 GMT+1): CANADA INFLATION (CPI) (JUNE). The CPI data is the Bank of Canada preferred inflation data, when it comes to interest rate decision making. If this data does not show a decline for June, then the Canadian Dollar might come under positive pressure.
- EVENT (FRIDAY, JULY 19 AT 13:30 GMT+1): CANADA RETAIL SALES (JUNE). The data will be closely watched before the Bank of Canda monetary policy meeting to be held on July 24. If the show higher than expected increase, the the Bank of Canada could be envouraged to keep rates unchanged at 4.75%. This, in turn, could be expected to have a positive impact on the Canadian Dollar.
USA:
- EVENT (WEDENDSAY, JULY 17 AT 13:30 GMT+1): US RETAIL SALES (JUNE). This set of data in tightly connected with the US inflation, which did show a bigger than expected decline in June. If Retail Sales show a decline for June, the US dollar could come under negative pressure as this could indicate a need for the US Fed to consider an interest rate cut from the current 5.50% sooner than previously thought.
- EVENT (THURSDAY, JULY 18 AT 13:30 GMT+1): US WEEKLY INITIAL JOBLESS CLAIMS. This type of report gets released every Thursday, once a week. It shows the number of people that lost their job for the first time and ask for unemployment assistance from the govrenment. If this number comes in higher than expected, this could be a negative sign from the labor market in the USA, and therefore it could impact the US dollar negatively.
- TECHNICAL ANALYSIS: THE USD/CAD IS TRADING NEAR THE TOP OF ITS SIDEWAYS CHANNEL (BETWEEN 1.3200 AND 1.3850). The chanel has been in place since mid- 2022, whereby the USD/CAD has tested the upper boundary of 1.38500 four times. On the downside, the USD/CAD has tested the lower boundery three times over the same period. The USD/CAD could be expected to soon undergo a downward correction after recently testing its upper boundary of 1.38500.
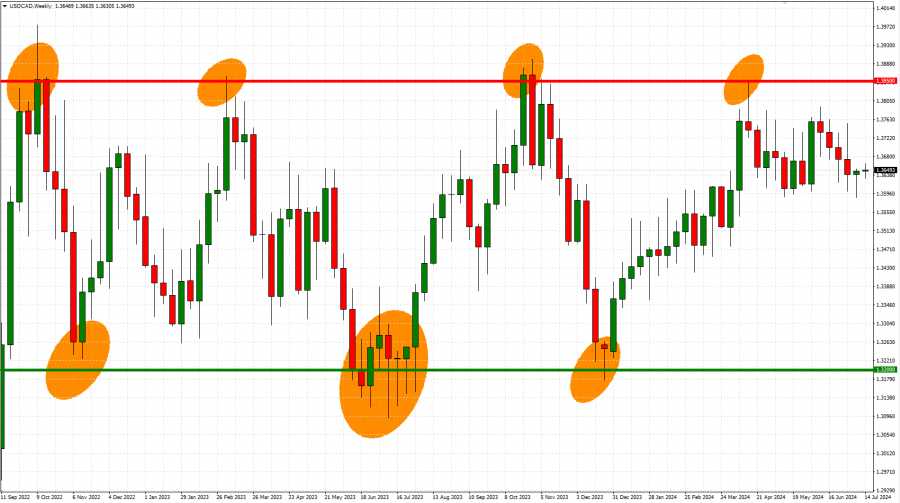
GRAPH: Weekly (July 2022 – June 2024)
Please note that past performance does not guarantee future results.
USD/CAD, July 15, 2024
Current Price: 1.3660
|
USD/CAD |
Weekly |
|
Trend direction |
|
|
1.3850 |
|
|
1.3800 |
|
|
1.3750 |
|
|
1.3550 |
|
|
1.3400 |
|
|
1.3200 |
Example of calculation based on weekly trnd direction for 1 Lot1
|
USD/CAD |
||||||
|
Pivot Points |
||||||
|
Profit or loss in $ |
-1,392 |
-1,026 |
-659 |
806 |
1,905 |
3,371 |
|
Profit or loss in €2 |
-1,277 |
-941 |
-605 |
740 |
1,748 |
3,093 |
|
Profit or loss in £2 |
-1,072 |
-790 |
-508 |
621 |
1,467 |
2,596 |
|
Profit or loss in C$2 |
-1,900 |
-1,400 |
-900 |
1,100 |
2,600 |
4,600 |
1. 1.00 lot is equivalent of 100,000 units
2. Calculations for exchange rate used as of 13:00 (GMT+1) 15/06/2024
There is a possibility to use Stop-Loss and Take-Profit.
- You may wish to consider closing your position in profit, even if it is lower than suggested one.
- Trailing stop technique could protect the profit.