Crude Oil weekly special report based on 1.00 Lot Calculation:
GEOPOLITICS:
- BREAKING (OCTOBER 4): CRUDE OIL JUMPS TO $76.445 (more than one month high) (UP 13.8% from $67.140) AFTER IRAN ATTACKS ISRAEL, ISRAEL SAID IT WILL RETALIATE WITHIN DAYS. Fears rose that Israel could be targeting the Iranian oil infrastructure next. Oil analysts and security experts have said Israel could target Iran's oil refining sites and the Kharg Island oil port, which handles around 90% of the country’s crude exports. Iran, on the other hand, said if Israel targets their oil infrastructure then Iran will target the oil infrastructure of other oil producers such as Azerbaijan (600,000 barrels a day of daily production), Oman (995,000 barrels a day of daily production), Saudi Arabia (8.9 million barrels a day of daily production), and the United Arab Emirates (2.95 million barrels a day of daily production) (TOTAL= 13.445 million barrels a day of oil production could come under attack, which is near 14% of total global oil production).
OIL MARKET: Other Analysis
- SCENARIOS: OIL PRICES EXPECTED TO REACT DIFFERENTLY UNDER DIFFERENT SCENARIOS. Scenario 1 assumes that an Israeli retaliatory attack against Iran could reduce global supply by near 3.5% of total global supply. Scenario 2 assumes that Iran will retaliate by attacking the oil infrastructure of other countries in the region such as Saudi Arabia, Azerbaijan, Oman or the United Arab Emirates. Under this scenario, the global oil market could lose up to 13.86% of total global oil supply. Scenario 3 is the worst case scenario, and therefore least likely to occur, assuming that Iran could shut down the most important passage of oil, the Strait of Hormuz. The passage handles at least 20 million barrels a day of daily oil supply, which represents around at least 20% of total global supply.
- EXPECTED PRICE REACTIONS: The expected price reactions below in the table are derived by calculating the average oil price reaction when the Russia-Ukranian conflict broke out in 2020, when Yemen’s Houthis attacked Saudi Arabia’s oil platforms, damaging 50% of Saudi Arabia’s oil production capacities in 2019, and when US Trum’s administration decided to pull out of the Nuclear Agreement to impose additional oil sanctions on Iran.
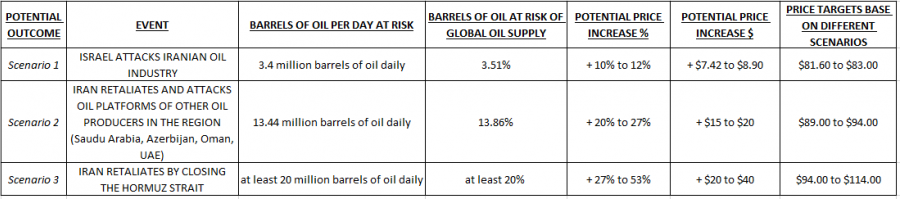
Data Source: Reuters, Bloomberg, CNBC
Potential Event Sources: Axios
Potential Price Reaction: Average Price From Previous Similar Events.
Please note that past performance does not guarantee future results
ANALYST OPINION:
- GOLDMAN SACHS: OIL PRICES COULD RISE BY $20. According to the Economic Times, Goldmans Sachs said that oil prices could jump by $20, or assuming a two million barrels per day six-month disruption to Iran supply, Brent could temporarily rise to a peak of $90 if OPEC rapidly offsets the shortfall, and a 2025 peak in the mid-$90s without an OPEC offset. However, the price could change further.
EVENTS
- SATURDAY (OCTOBER 13): CHINA ANNOUNCED STRATEGY TO IMPLEMENT THE NEW STIMULUS MEASURES ON SATURDAY. China’s finance ministry said over the weekend that it will roll out fiscal stimulus measures, including more debt issuances and support for provincial governments, but left investors guessing on the overall size of the stimulus package, a vital detail to gauge the longevity of its recent stock market rally.
- WEDNESDAY (OCTOBER 16) AT 21:30 GMT+1: US WEEKLY OIL INVENTORIES DATA (AMERICAN PETROLEIUM INSTITUTE). If the report shows inventories declines, this could mean that demand in the US remans strong, which could further support oil prices. The API report for the previous week showed a build of 10.9 million barrels.
- THURSDAY (OCTOBER 17) AT 16:00 GMT+1: US WEEKLY OIL INVENTORIES DATA (US GOVERNMENT). If the report shows inventories declines, this could mean that demand in the US remains strong, which could further support oil prices. The US Government report for the previous week showed a build of 5.81 million barrels.
Crude Oil, October 15, 2024
Current Price: 70.00
|
Crude Oil |
Weekly |
|
Trend direction |
|
|
100.00 |
|
|
90.00 |
|
|
75.00 |
|
|
66.00 |
|
|
65.00 |
|
|
63.00 |
Example of calculation base on weekly trend direction for 1.00 Lot1
|
Crude Oil |
||||||
|
Pivot Points |
||||||
|
Profit or loss in $ |
30,000.00 |
20,000.00 |
5,000.00 |
-4,000.00 |
-5,000.00 |
-7,000.00 |
|
Profit or loss in €2 |
27,515.11 |
18,343.41 |
4,585.85 |
-3,668.68 |
-4,585.85 |
-6,420.19 |
|
Profit or loss in £2 |
22,944.64 |
15,296.43 |
3,824.11 |
-3,059.29 |
-3,824.11 |
-5,353.75 |
|
Profit or loss in C$2 |
41,423.55 |
27,615.70 |
6,903.93 |
-5,523.14 |
-6,903.93 |
-9,665.50 |
1. 1.00 lot is equivalent of 1000 units
2. Calculations for exchange rate used as of 10:00 (GMT+1) 15/10/2024
There is a possibility to use Stop-Loss and Take-Profit.
- You may wish to consider closing your position in profit, even if it is lower than the suggested one.
- Trailing stop technique could protect the profit.