Crude Oil weekly special report based on 1.00 Lot Calculation:
TECHNICAL ANALYSIS:
-
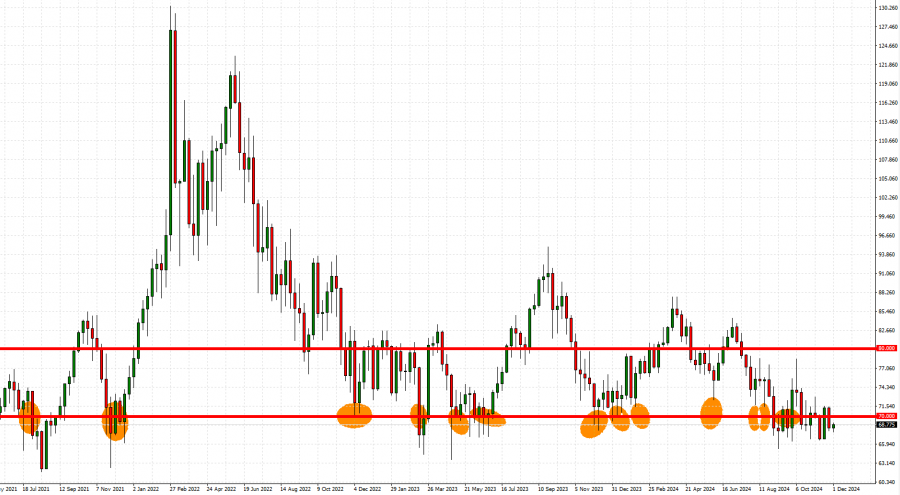
CRUDE OIL PRICES HAVE TESTED THE MARK OF $70 (OR NEAR) 13 TIMES SINCE 2021. This is the 14th time that Crude Oil prices are testing levels near the mark of $70.

GRAPH (Weekly): July 2021 – November 2024
Please note that past performance does not guarantee future results
-
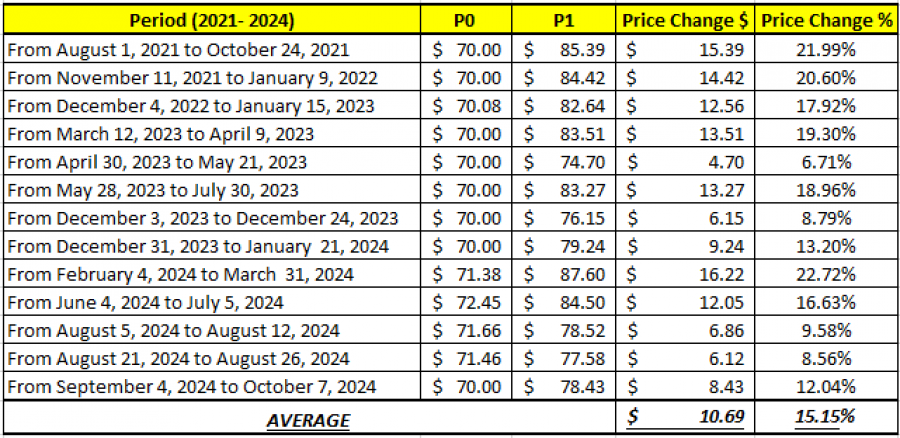
2021- 2024 STATISTICS: CRUDE OIL TENDS TO RECOVER BY AROUND 15% AFTER TESTING THE MARK OF $70 OR NEAR IT.

DATA SOURCE: Fortrade MetaTrader 4
Please note that past performance does not guarantee future results
MAIN EVENT:
-
OPEC+ MEETING (THURSDAY, DECEMBER 5). The group could be expected to once again step up efforts to support the oil market, having in mind that oil price has recently fallen to levels near $66 a barrel. One thing they could do is once again delay the start of its planned oil production increase, which was supposed to begin on January 1, 2025. If true, then oil prices could see some recovery.
OTHER EVENTS:
-
TUESDAY, DECEMBER 3 AT 21:30 GMT: AMERICAN PETROLEUM INSTITUTE (API) WEEKLY OIL INVENTORY DATA (USA). Last week, data showed an unexpected decrease in inventories of 5.935 million barrels. If data this week shows that the trend is the same and a decline in inventory is reported, then oil prices could come under positive pressure, as this could signal an improving demand outlook in the USA.
-
WEDNESDAY, DECEMBER 4 AT 15:30 GMT: ENERGY INFORMATION ADMINISTRATION (EIA) WEEKLY OIL INVENTORY DATA (USA). Data last week showed a larger than expected decrease in inventories (-1.84 million barrels vs. -1.300 million barrels expected), and all that compared to the previous week’s increase of 0.545 million barrels. If data shows a decline in inventories, oil prices could be expected to react positively as this could signal stronger oil demand in the USA.
ANALYST OPINION:
-
BANKS: Morgan Stanley forecasts a range between $77-$80; Goldman Sachs forecasts a range between $74.5-$77.5; JPMorgan forecasts a range between $77-$80; UBS forecasts a range between $77-$80;
Crude Oil, December 3, 2024
Current Price: 68.50
|
Crude Oil |
Weekly |
|
Trend direction |
|
|
80.00 |
|
|
77.00 |
|
|
72.00 |
|
|
65.50 |
|
|
65.00 |
|
|
64.00 |
Example of calculation base on weekly trend direction for 1.00 Lot1
|
Crude Oil |
||||||
|
Pivot Points |
||||||
|
Profit or loss in $ |
11,500 |
8,500 |
3,500 |
-3,000 |
-3,500 |
-4,500 |
|
Profit or loss in €2 |
10,926 |
8,076 |
3,325 |
-2,850 |
-3,325 |
-4,275 |
|
Profit or loss in £2 |
9,071 |
6,705 |
2,761 |
-2,366 |
-2,761 |
-3,550 |
|
Profit or loss in C$2 |
16,124 |
11,917 |
4,907 |
-4,206 |
-4,907 |
-6,309 |
- 1.00 lot is equivalent of 1000 units
- Calculations for exchange rate used as of 10:30 (GMT) 03/12/2024
There is a possibility to use Stop-Loss and Take-Profit.
-
You may wish to consider closing your position in profit, even if it is lower than the suggested one.
-
Trailing stop technique could protect the profit.