Crude Oil weekly special report based on 1.00 Lot Calculation:
GEOPOLITICS:
- BREAKING (FEBRUARY 1): US PRESIDENT TRUMP IMPOSED TARIFFS ON OIL IMPORTS FROM CANADA AND MEXICO: Effective February 1, the tariffs include a 10% tariff on Canadian energy products and a 25% levy on Mexican energy products. Canada and Mexico, key suppliers of crude oil to the U.S., provide about 25% of the oil processed by U.S. refineries into fuels like gasoline and heating oil, according to the U.S. Department of Energy.
- US PRESIDENT TRUMP EXPECTED TO INCREASE PRESSURE ON IRAN. President Trump is expected to impose new sanctions on Iranian oil to slash Iranian oil exports to a minimum from the current near 1.6 million barrels a day.
- US PRESIDENT DONALD TRUMP SAID THE U.S.A. WILL REFILL ITS STRATEGIC PETROLEUM RESERVES (SPR). This could be bullish for oil prices by boosting demand for U.S. crude oil. PERSPECTIVE: The Biden administration released around 200 million barrels during the Covid era and bought back around 50 million barrels of oil, meaning that at least 150 million barrels of oil should be bought in the coming period.
- BREAKING (JANUARY 13): US, UK IMPOSE NEW OIL SANCTIONS ON RUSSIA TARGETING 183 VESSELS THAT HAVE SHIPPED RUSSIAN OIL, HANDLING MORE THAN 530 MILLION BARRELS LAST YEAR (1.75 million barrels a day) OR 42% OF RUSSIA’S SEABORNE CRUDE EXPORTS AND 25% OF TOTAL RUSSIA’S EXPORTS. Russian oil exports will be hurt severely by the new sanctions, pushing China and India, the world's top and third-largest oil importers, respectively, to source more crude from the Middle East, Africa, and the Americas. Earlier, Russia had some room to maneuver despite the new sanctions, but it would ultimately need to acquire non-sanctioned tankers or offer crude at or below $60 a barrel to use Western insurance as per the West's price cap (Source: Reuters).
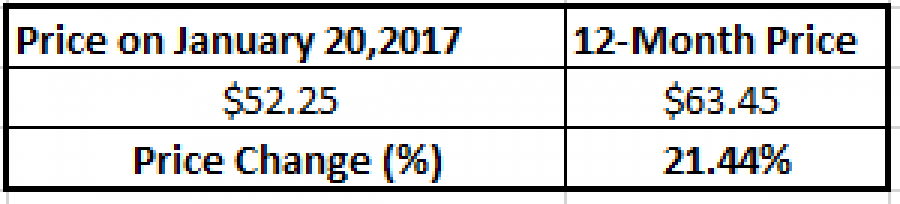
STATISTICS: CRUDE OIL PRICE REACTION UNDER DONALD TRUMP PRESIDENCY
- CRUDE OIL ROSE 21.44% DURING TRUMP’S FIRST YEAR OF PRESIDENCY (JANUARY 20, 2017 – JANUARY 20, 2018).
Data Source: MetaTrader 4 Platform
Please note that past performance does not guarantee future results
EVENTS:
- TUESDAY, FEBRUARY 4 AT 21:30 GMT: AMERICAN PETROLEUM INSTITUTE (API) WEEKLY OIL INVENTORY DATA. If inventory growth comes in lower than expected, it could signal tighter supply, supporting higher oil prices. Conversely, higher-than-expected growth could exert downward pressure on prices.
- WEDNESDAY, FEBRUARY 5 AT 15:30 GMT: US GOVERNMENT (EIA) WEEKLY OIL INVENTORY DATA. According to last week's U.S. government reports, oil inventories rose by 3.46 million barrels after nine consecutive weeks of decline. If the next report indicates a return to the previous trend of decreasing inventories, it could help and drive oil prices up. Conversely, continued inventory increases could put downward pressure on prices.
ANALYST OPINION
- BREAKING (JANUARY 31): GOLDMAN SACHS PROJECTS OIL AT $75- $78 IN 2025. Goldman Sachs says that they are looking for an average peak of around $80 in April to May. But the firm estimates that Brent oil could rise to as high as $93 when sanctioned supply falls (in the case of Iran and Russia).
Crude Oil, February 3, 2025
Current Price: 74.40
|
Crude Oil |
Weekly |
|
Trend direction |
|
|
90.00 |
|
|
85.00 |
|
|
79.00 |
|
|
70.00 |
|
|
69.00 |
|
|
68.00 |
Example of calculation based on weekly trend direction for 1.00 Lot1
|
Crude Oil |
||||||
|
Pivot Points |
||||||
|
Profit or loss in $ |
15,600 |
10,600 |
4,600 |
-4,400 |
-5,400 |
-6,400 |
|
Profit or loss in €² |
15,216 |
10,339 |
4,487 |
-4,292 |
-5,267 |
-6,243 |
|
Profit or loss in £² |
12,664 |
8,605 |
3,734 |
-3,572 |
-4,384 |
-5,196 |
|
Profit or loss in C$² |
22,887 |
15,551 |
6,749 |
-6,455 |
-7,922 |
-9,389 |
1. 1.00 lot is equivalent of 1000 units
2. Calculations for exchange rate used as of 12:00 (GMT) 03/02/2025
There is a possibility to use Stop-Loss and Take-Profit.
- You may wish to consider closing your position in profit, even if it is lower than the suggested one.
- Trailing stop techniques could protect the profit.