Crude Oil weekly special report based on 1.00 Lot Calculation:
TECHNICAL ANALYSIS:
- CRUDE OIL PRICE AT THE LOWEST SINCE FEBRUARY 2021 ($55.115): Crude oil prices have fallen to their lowest in more than four years.
- LONG-TERM SUPPORT AREA BELOW THE PSYCHOLOGICAL MARK OF $60: Crude oil price has recently tested levels below $60, which has been acting as a support area since early 2021.
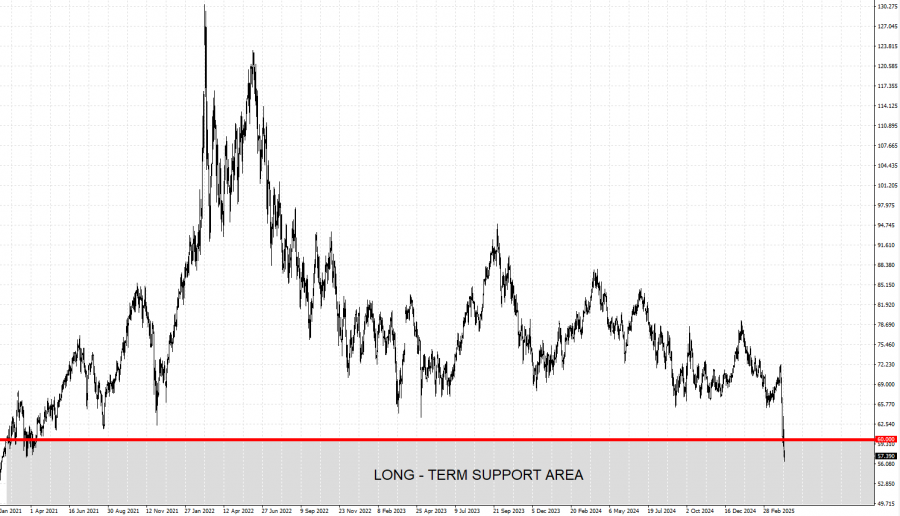
GRAPH (Daily): February 2021 – April 2025
Please note that past performance does not guarantee future results
OIL PRICE ANALYSIS (DRILLING NEW WELLS): U.S.A.
- LARGE FIRM PRODUCERS (ABOVE 10,000 barrels a day) NEED AN AVERAGE OF $58 A BARREL MARKET PRICE TO PROFITABLY DRILL. This is the average price of oil for larger (firm) oil producers to be profitable drilling new oil wells.
- SMALL FIRM PRODUCERS (LESS THAN 10,000 barrels a day) NEED AN AVEARGE OF $67 A BARREL MARKET PRICE TO PRFITABLY DRILL. This is the average price of oil for smaller (firm) oil producers to be profitable drilling new oil wells.
- AVERAGE BREAKEVEN PRICE ACROSS REGIONS (FOR NEW WELL DRILLING): $59 - $70. This is the average price range of oil across various regions in the US for firms to be profitable drilling new oil wells.
Source: dallasfed.org
GEOPOLITICS:
- MIDDLE EAST TENSIONS RISE AS US TRUMP’S “ULTIMATUM” TO IRAN APPROACHES ITS DEADLINE (Early to Mid- May). According to Reuters, President Trump's letter to Iran's Supreme Leader Ali Khamenei included a two-month deadline (until early to mid-May) for reaching a new nuclear deal. In addition, Trump threatened bombing Iran if Iran do not make a deal on nuclear program. These developments increased chances for a potential military action in the Middle East, rich in oil, and responsible for 20% to 30% of total global supply.
- VENEZUELA OIL EXPORTS UNDER PRESSURE: US PRESIDENT TRUMP IMPOSED 25% SECONDORY IMPORT TARIFFS FOR COUNTRIES THAT BUY OIL FROM VENEZUELA. According to Reuters, U.S. President Donald Trump issued an executive order declaring that any country buying oil or gas from Venezuela will pay a 25% tariff on trades with the U.S.
EVENTS (OIL):
- WEDNESDAY, APRIL 9 AT 15:30 GMT+1: ENERGY INFORMATION ADMINISTRATION (EIA) WEEKLY OIL INVENTORY DATA (USA). If data showed a declining inventory for the past week, then positive support for the oil price could be expected.
OTHER EVENTS (ECONOMIC):
- THURSDAY, APRIL 10, AT 13:30 GMT+1: U.S. INFLATION (CPI) (MARCH): This index measures the change in the price of the goods and services from the perspective of the consumer. Inflation in February came in at 2.8%, which was lower than analyst expectations of 2.9%.
Crude Oil, April 9, 2024
Current Price: 55.20
|
Crude Oil |
Weekly |
|
Trend direction |
|
|
70.00 |
|
|
65.00 |
|
|
61.00 |
|
|
50.00 |
|
|
49.50 |
|
|
49.00 |
Example of calculation based on weekly trend direction for 1.00 Lot1
|
Crude Oil |
||||||
|
Pivot Points |
||||||
|
Profit or loss in $ |
14,800 |
9,800 |
5,800 |
-5,200 |
-5,700 |
-6,200 |
|
Profit or loss in €² |
13,357 |
8,845 |
5,235 |
-4,693 |
-5,144 |
-5,596 |
|
Profit or loss in £² |
11,563 |
7,656 |
4,531 |
-4,063 |
-4,453 |
-4,844 |
|
Profit or loss in C$² |
20,962 |
13,880 |
8,215 |
-7,365 |
-8,073 |
-8,781 |
1. 1.00 lot is equivalent of 1000 units
2. Calculations for exchange rate used as of 12:00 (GMT+1) 09/04/2025
There is a possibility to use Stop-Loss and Take-Profit.
- You may wish to consider closing your position in profit, even if it is lower than the suggested one.
- Trailing stop techniques could protect the profit.