General Motors (#GM) weekly special report based On 1 Lot Calculation:
SPECIAL REPORT: General Motors
DATE: March 28, 2023
EVENT: Channel Price Movement
TECHNICAL REVIEW:
- CHANNEL PRICE MOVEMENT: GENERAL MOTORS HAS BEEN TRADING IN THE RANGE OF $33 - $41 SINCE APRIL 2022. This is the fourth time to test the lower boundary of the channel (SUPPORT= $33). After testing the support of $41, General Motors would tend to come back up to $41 (RESISTANCE), which is the upper boundary of this channel.
Please note that past performance does not guarantee future results.
- MAIN PARAMETERS:
RESISTANCE: $41
REFERENCE PRICE: $37
SUPPORT: $33
- CHANNEL TRADING MAIN SCENARIOS:
- SCENARIO 1: IF CURRENT PRICE TRADES BELOW THE REFERENCE PRICE OF $37 (BETWEEN $33 AND $37), THEN AN UPWARD MOVEMENT MAY BE EXPECTED. TARGET: $41
- SCENARIO 2: IF CURRENT PRICE TRADES ABOVE REFERENCE PRICE OF $37 (BETWEEN $37 AND $41), THEN A DOWNWARD MOVEMENT MAY BE EXPECTED. TARGET: $33
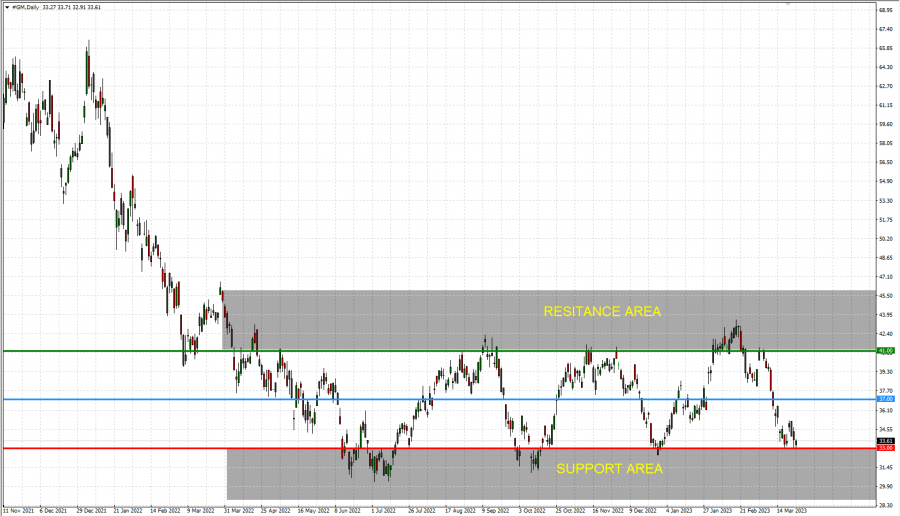
GRAPH: Weekly Chart General Motors (2019- 2023)
Source: Fortrade MetaTrader4 Platform
CURRENT PRICE: $34.5
Example of calculation based on weekly trend direction for 1 Lot1
|
General Motors |
||
|
|
||
|
levels |
$41.00 |
$33.00 |
|
Profit or loss in $ |
6,500.00 |
-1,500.00 |
|
Profit or loss in €² |
6,009.59 |
-1,386.83 |
|
Profit or loss in £² |
5,287.69 |
-1,220.24 |
|
Profit or loss in C$² |
8,895.67 |
-2,052.85 |
- 1.00 lot is equivalent of 1000 units
- Calculations for exchange rate used as of 10:20(GMT+1) 28/03/2023
Fortrade recommends the use of Stop-Loss and Take-Profit, please speak to your Senior Account ManagerClient Manager regarding their use.
- You may wish to consider closing your position in profit, even if it is lower than suggested one
- Trailing stop technique can protect the profit – Ask your Senior Account ManagerClient Manager for more detail