GER 40 Index Weekly Special Report based on 1.00 Lot Calculation:
-
The GER40 index represents the DAX 40 index in Germany, which includes companies such as Adidas, Bayer, Daimler, Deutsche Bank, Siemens, BMW, E.ON and etc. In essence, the index includes the most valuable and advanced companies in Germany, the largest economy in Europe.
-
EVENT (THURSDAY, NOVEMBER 14 AT 10:00 GMT): EUROZONE GROSS DOMESTIC PRODUCT (GDP) (Q3). The Eurozone economy has been expected to have grown by 0.9% in Q3 of 2024, which is up fromm Q2’s 0.6% growth rate. Expanding economic activity is positive for the European stock market sentiment, which could put upward pressure on the GER40 index too.
-
EVENT (THURSDAY, DECEMBER 12 AT 13:15 GMT): EUROPEAN CENTRAL BANK (ECB) INTEREST RATE CUT DECISION. The decision will be followed by a press conference at 13:45 GMT. The ECB cut its benchmark interest rate in October from 3.65% to the current 3.40%, and investors expect the ECB could continue with their rate cutting cycle on. The benchmark interest rate in the Eurozone is now expected to be slashed below 3.40%. If the ECB does decide on an interest rate cut, this could push the GER40 higher as borrowing costs for businesses could become lower and therefore allow for the economy to grow and expand.
-
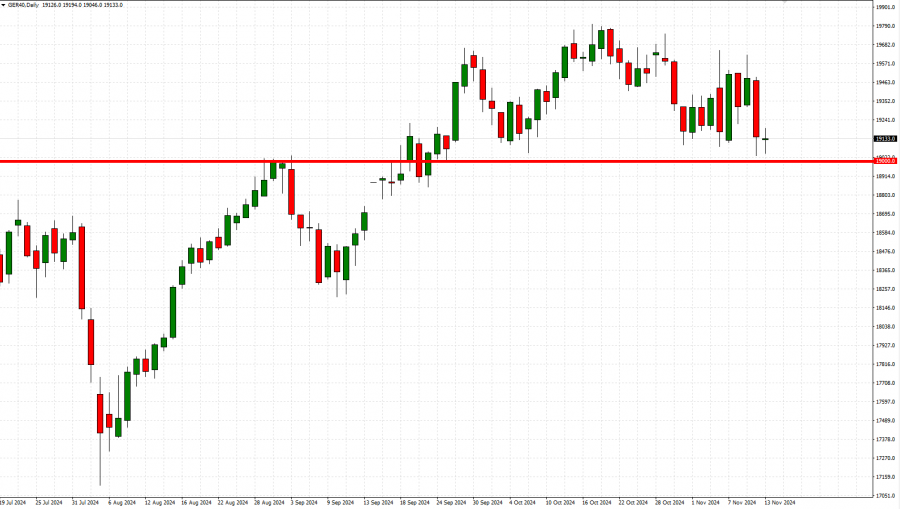
GER40 INDEX HIT AN ALL- TIME HIGH OF 19,800 (OCTOBER 17, 2024). Most recent interest rate cuts in the Eurozone have supported the GER40 index positively as the index managed to rise to fresh all- time highs, gaining around 6%, after the interest rate cut cycle in the Eurozone began on June 6, 2024.
-
TECHNICAL ANALYSIS: STORNG SUPPORT AT 19,000. After rising to fresh highs, the GER40 index has started respecting the psychological support at 19,000 since late September 2024. The index has traded near 19,000, suggesting limited downside potential from here.

GRAPH: Daily (July 2024 – November 2024)
Please note that past performance does not guarantee future results.
GER40, November 13, 2024
Current Price: 19,100
|
GER40 |
Weekly |
|
Trend direction |
|
|
20,200 |
|
|
19,800 |
|
|
19,500 |
|
|
18,750 |
|
|
18,650 |
|
|
18,500 |
Example of calculation based on weekly trend direction for 1.00 Lot1
|
Pivot Points |
||||||
|
Profit or loss in $2 |
11,683 |
7,435 |
4,249 |
-3,717 |
-4,780 |
-6,373 |
|
Profit or loss in € |
11,000 |
7,000 |
4,000 |
-3,500 |
-4,500 |
-6,000 |
|
Profit or loss in £2 |
9,168 |
5,834 |
3,334 |
-2,917 |
-3,750 |
-5,000 |
|
Profit or loss in C$2 |
16,302 |
10,374 |
5,928 |
-5,187 |
-6,669 |
-8,892 |
-
1.00 lot is equivalent of 10 units
-
Calculations for exchange rate used as of 10:20 (GMT) 13/11/2024
There is a possibility to use Stop-Loss and Take-Profit.
-
You may wish to consider closing your position in profit, even if it is lower than suggested one.
-
Trailing stop technique could protect the profit.