Natural Gas weekly special report based on 1.00 Lot Calculation:
US NATURAL GAS
- Natural Gas is one of the cleanest among the types of fosil fuel, which increases its demand in times when climate changes happen.
- US ELECTRICTY PRODUCTION: The US Government projected power demand will rise to 4,103 billion kilowatt-hours (kWh) in 2024 and 4,159 billion kWh in 2025. That compares with 4,000 billion kWh in 2023 and a record 4,067 billion kWh in 2022.
- AROUND 40% OF ELECTRICITY IN THE U.S. IS PRODUCED FROM NATURAL GAS: Rising consumtion of electricity in the US will be accompanied by rising demand for natural gas. As hot temperatures strike the US, households and companies can be expected to increase usage of air conditioning. This in turn increases demand for electricity, which drags up natural gas consumption, on the other hand.
NATURAL GAS SEASONAL BEHAVIOUR:
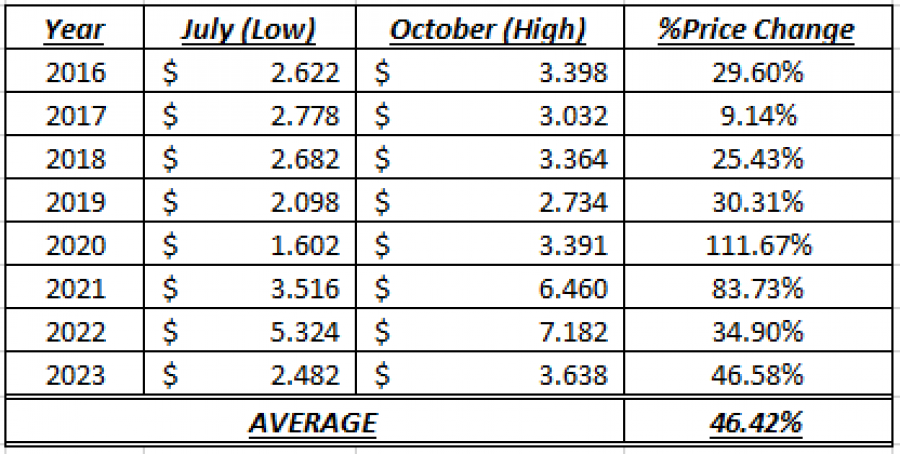
- SEASONAL EFFECTS HISTORICALLY IMPACT NATURAL GAS PRICES WITH AN AVERAGE INCREASE OF 46.42% FROM JULY LOWS TO OCTOBER HIGHS (2016-2023): As shown by the table below, Natural Gas usually goes up between July and October. The move fundamentally could be explained by rising natural gas demand during hot months (air conditioning) like July and August and fears over natural gas shortages ahead of the winter season that starts in October.
DATA SOURCE: MetaTrader 4 Platform
Please note that past performance does not guarantee future results.
EVENTS:
- THURSDAY (JULY 18) AT 15:30 GMT+1: US WEEKLY NATURAL GAS STORAGE DATA (US GOVERNMENT). Analysts expect to see an increase in the US oil inventories for the past week, but at a slower pace due to ongoing hot weather in the US. If the inventories rise at a pace slower than expected, this could then support positively the natural gas prices.
TECHNICAL ANALYSIS:
- NATURAL GAS HAS TESTED ITS LOWEST LEVEL IN TEN WEEKS ($2.144)
- NATURAL GAS HAS TESTED THE LEVEL OF $2 (OR NEAR) SEVEN TIMES SINCE 2000.
- AFTER TESTING $2 (OR NEAR), NATURAL GAS WOULD BOUNCE BACK TOWARDS AT LEAST $3.
TECHNICAL REVIEW: The price has fallen to its traditional bottom of around 2.00. The bottom near 2 has been tested only seven times since November 2000. AVERAGE: on average, Natural Gas trades this low every 3-4 years.
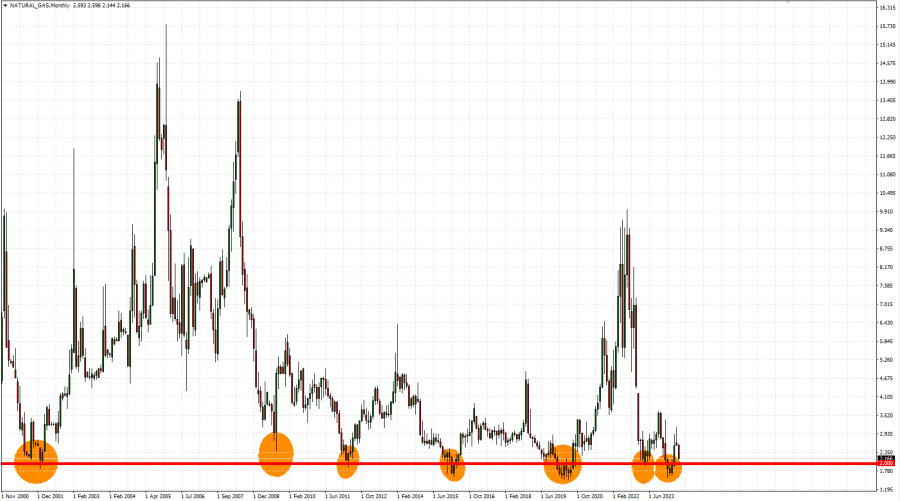
Monthly Graph: November 2000 – July 2024
Please note that past performance does not guarantee future results.
Natural Gas, July 16, 2024
Current Price: 2.160
|
Natural Gas |
Weekly |
|
Trend direction |
|
|
4.000 |
|
|
3.000 |
|
|
2.500 |
|
|
1.900 |
|
|
1.850 |
|
|
1.800 |
Example of calculation base on weekly trend direction for 1.00 Lot1
|
Natural Gas |
||||||
|
Pivot Points |
||||||
|
Profit or loss in $ |
18,400 |
8,400 |
3,400 |
-2,600 |
-3,100 |
-3,600 |
|
Profit or loss in €2 |
16,889 |
7,710 |
3,121 |
-2,387 |
-2,845 |
-3,304 |
|
Profit or loss in £2 |
14,197 |
6,481 |
2,623 |
-2,006 |
-2,392 |
-2,778 |
|
Profit or loss in C$2 |
25,175 |
11,493 |
4,652 |
-3,557 |
-4,241 |
-4,925 |
1. 1.00 lot is equivalent of 10,000 units
2. Calculations for exchange rate used as of 09:30 (GMT+1) 16/07/2024
There is a possibility to use Stop-Loss and Take-Profit.
- You may wish to consider closing your position in profit, even if it is lower than suggested one.
- Trailing stop technique could protect the profit.