Natural Gas weekly special report based On 1 Lot Calculation:
US NATURAL GAS
- Natural Gas is one of the cleanest among the types of fossil fuel, which increases its demand in times when climate changes happen.
- US ELECTRICITY PRODUCTION: The US Government projected power demand will rise to 4,103 billion kilowatt-hours (kWh) in 2024 and 4,159 billion kWh in 2025. That compares with 4,000 billion kWh in 2023 and a record 4,067 billion kWh in 2022.
- AROUND 40% OF ELECTRICITY IN THE U.S. IS PRODUCED FROM NATURAL GAS: Rising consumption of electricity in the US will accompany rising demand for natural gas. As hot temperatures strike the US, households, and companies can be expected to increase air conditioning usage. This increases electricity demand, which drags up natural gas consumption, on the other hand.
FUNDAMENTAL FACTORS:
- GEOPOLITICAL TENSIONS: Fears of Middle East conflict spreading are growing after Iran announced plans to attack Israel, potentially disrupting LNG shipments to Europe. Qatar, a major LNG supplier, could be affected. Meanwhile, Ukrainian forces attacked near the Sudzha gas facility in Russia's Kursk region, the last operational transit point for Russian gas to Europe via Ukraine.
- MAJOR US PRODUCERS CUTTING PRODUCTION: Major U.S. natural gas producers, including EQT, Apache, and Chesapeake Energy, plan to continue restricting production by 0.5 Bcf/d in the second half of 2024, according to Reuters.
NATURAL GAS PRICE SEASONAL BEHAVIOR:
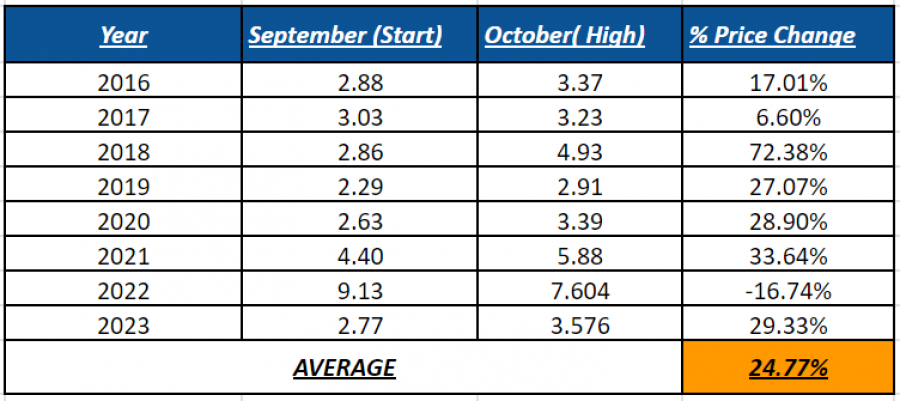
- SEASONAL EFFECTS HISTORICALLY IMPACT NATURAL GAS PRICES WITH AN AVERAGE INCREASE OF 24.77% FROM BEGINNING OF SEPTEMBER TO OCTOBER HIGHS (2016-2023): As shown by the table below, Natural Gas usually goes up between September and October. The move fundamentally could be explained by rising natural gas demand due to the fears over natural gas shortages ahead of the winter season that starts in October.

DATA SOURCE: MetaTrader 4 Platform
Please note that past performance does not guarantee future results.

Monthly Graph: November 2000 – July 2024
Please note that past performance does not guarantee future results.
NATURAL GAS, September 04, 2024
Current Price: 2.18
|
NATURAL GAS |
Weekly |
|
Trend direction |
|
|
4.500 |
|
|
3.400 |
|
|
2.700 |
|
|
1.700 |
|
|
1.600 |
|
|
1.500 |
Example of calculation based on weekly trend direction for 1 Lot1
|
Pivot Points |
||||||
|
Profit or loss in $ |
23,200.00 |
12,200.00 |
5,200.00 |
-4,800.00 |
-5,800.00 |
-6,800.00 |
|
Profit or loss in €² |
21,016.65 |
11,051.86 |
4,710.63 |
-4,348.27 |
-5,254.16 |
-6,160.05 |
|
Profit or loss in £² |
17,686.50 |
9,300.66 |
3,964.22 |
-3,659.28 |
-4,421.62 |
-5,183.97 |
|
Profit or loss in C$² |
31,408.65 |
16,516.62 |
7,039.87 |
-6,498.34 |
-7,852.16 |
-9,205.98 |
1. 1 lot is equivalent of 10,000 units
2. Calculations for exchange rate used as of 10:20 (GMT+1) 04/09/2024
Fortrade recommends the use of Stop-Loss and Take-Profit, please speak to your Senior Account Manager regarding their use.
· You may wish to consider closing your position in profit, even if it is lower than suggested one
· Trailing stop technique can protect the profit – Ask your Senior Account Manager for more details