Natural Gas weekly special report based on 1.00 Lot Calculation:
US NATURAL GAS
- Natural Gas is one of the cleanest among the types of fosil fuel, which increases its demand in times when climate changes happen.
- AROUND 40% OF ELECTRICITY IN THE U.S. IS PRODUCED FROM NATURAL GAS: Rising consumtion of electricity in the US will be accompanied by rising demand for natural gas.
- AROUND 40% OF US HOUSEHOLDS USE NATURAL GAS FOR HEATING: As cold temperatures strike the US, households can be expected to increase usage due to rising heating demand.
- U.S.A. IS ONE OF THE LARGEST EXPORTERS OF LIQUIFIED NATURAL GAS (LNG) IN THE WORLD. In total, the US exported 88.3 million tons of LNG in 2024, up 4.4% from 2023’s 84.5 million tons.
EUROPE EXPECTED TO SOON START BUYING BIG QUANTITIES OF NATURAL GAS
- EUROPEAN NATURAL GAS STORAGE REFILLING SEASON STARTS: MARCH- APRIL
- EUROPEAN NATURAL GAS STORAGE REFILLING SEASON ENDS: NOVEMBER
- MANDATE: EUROPEAN NATURAL GAS STORAGE MUST BE FULL AT LEAST 90% BY NOVEMBER
- CURRENT: AT AROUND 43%
- EUROPE BUYS BIG QUANTITIES OF LIQUIFIED NATURAL GAS (LNG) FROM USA: 50% of total LNG imports to Europe comes from the USA. In December, Europe imported 10.89 million tons, of which, 5.84 million tons came from the USA.
- 69% OF TOTAL U.S. LNG EXPORTS WENT TO EUROPE IN DECEMBER 2024: The US exported 8.5 million tons of LNG in December, of which, 5.84 million tons went to Europe.
- EUROPE IS PRESSED TO INCREASE BUYING FROM THE USA OR TO FACE TARIFFS: US PRESIDENT DONALD TRUMP.
- STATISTICS (2016 - 2024): NATURAL GAS PRICES ROSE 18.72% ON AVERAGE WHEN EUROPEAN REFILLING SEASON STARTED (MARCH - APRIL).
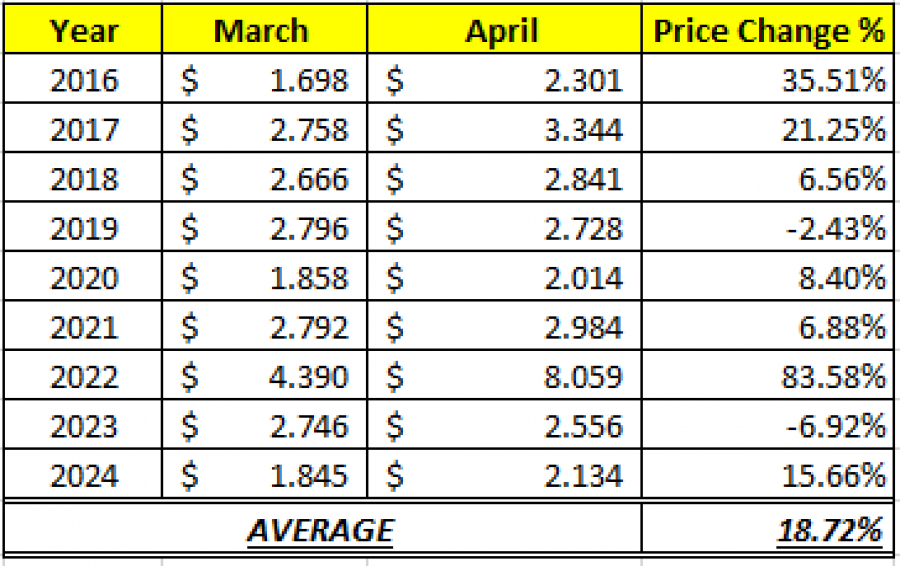
Data Source: Meta Trader 4 Platform
Please note that past performance does not guarantee future results
- STATISTICS (2016 - 2024): NATURAL GAS PRICES ROSE 47.80% ON AVERAGE DURING THE EUROPEAN REFILLING SEASON (MARCH – NOVEMBER)
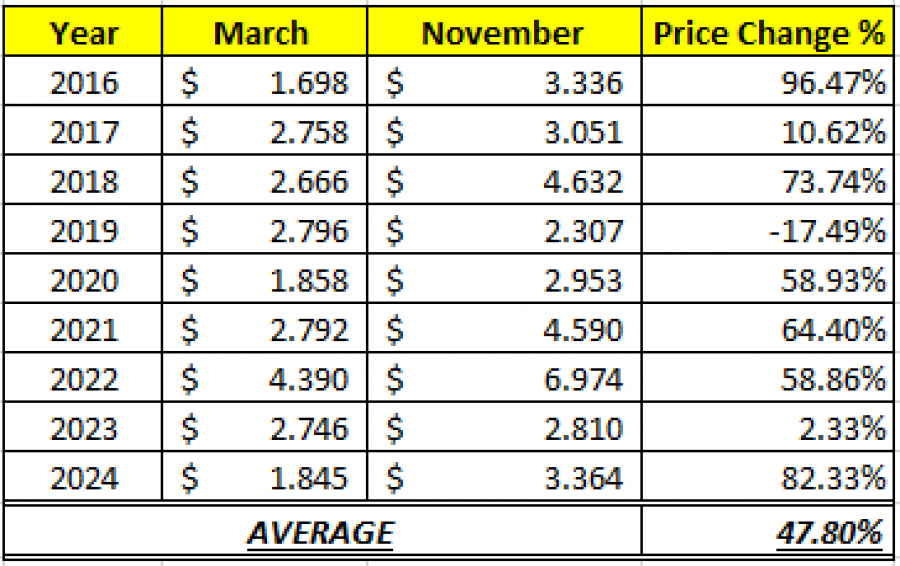
Data Source: Meta Trader 4 Platform
Please note that past performance does not guarantee future results
Natural Gas, February 20, 2025
Current Price: 4.10
|
Natural Gas |
Weekly |
|
Trend direction |
|
|
6.00 |
|
|
5.30 |
|
|
4.70 |
|
|
3.60 |
|
|
3.30 |
|
|
3.00 |
Example of calculation base on weekly trend direction for 1.00 Lot1
|
Natural Gas |
||||||
|
Pivot Points |
||||||
|
Profit or loss in $ |
19,000 |
12,000 |
6,000 |
-5,000 |
-8,000 |
-11,000 |
|
Profit or loss in €2 |
18,175 |
11,479 |
5,739 |
-4,783 |
-7,653 |
-10,522 |
|
Profit or loss in £2 |
15,061 |
9,512 |
4,756 |
-3,963 |
-6,341 |
-8,719 |
|
Profit or loss in C$2 |
26,952 |
17,022 |
8,511 |
-7,093 |
-11,348 |
-15,604 |
1. 1.00 lot is equivalent of 10,000 units
2. Calculations for exchange rate used as of 14:30 (GMT) 20/02/2025
There is a possibility to use Stop-Loss and Take-Profit.
- You may wish to consider closing your position in profit, even if it is lower than suggested one.
- Trailing stop technique could protect the profit.