Natural Gas weekly special report based on 1.00 Lot Calculation:
EUROPE EXPECTED TO SOON START IMPORTING NATURAL GAS
- EUROPEAN NATURAL GAS STORAGE REFILLING SEASON STARTS MARCH- APRIL AND ENDS IN NOVEMBER.
- MANDATE: EUROPEAN NATURAL GAS STORAGE MUST BE FULL AT LEAST 90% BY NOVEMBER
- CURRENT: AT BELOW 35%
- EUROPE EXPECTED TO START IMPORTING LIQUIFIED NATURAL GAS (LNG) FROM THE USA: US supplies 50% of Europe's total LNG imports.
- 82% OF TOTAL U.S. LNG EXPORTS WENT TO EUROPE IN FEBRUARY 2024: In February, the U.S. exported 8.35 million tons of LNG. Of the total exports, 6.82 million tons (82%) went to Europe.
- EUROPE MUST INCREASE PURCHASE FROM THE USA OR TO FACE TARIFFS ACCORDING TO US PRESIDENT DONALD TRUMP.
- STATISTICS (2016 - 2024): NATURAL GAS PRICES ROSE 18.72% ON AVERAGE AT THE START OF THE EUROPEAN REFILLING SEASON (MARCH - APRIL).
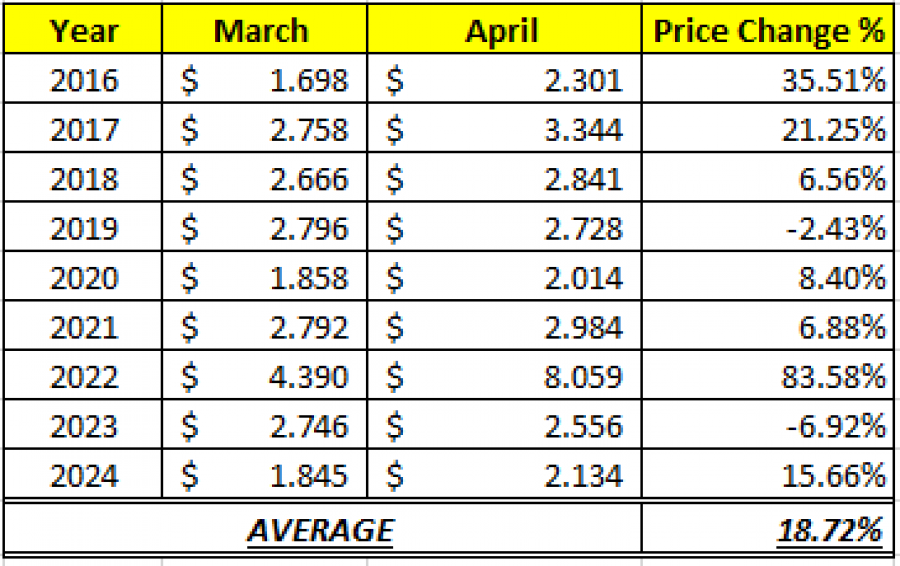
Data Source: Meta Trader 4 Platform
Please note that past performance does not guarantee future results
- STATISTICS (2016 - 2024): NATURAL GAS PRICES ROSE 47.80% ON AVERAGE DURING THE EUROPEAN REFILLING SEASON (MARCH – NOVEMBER)
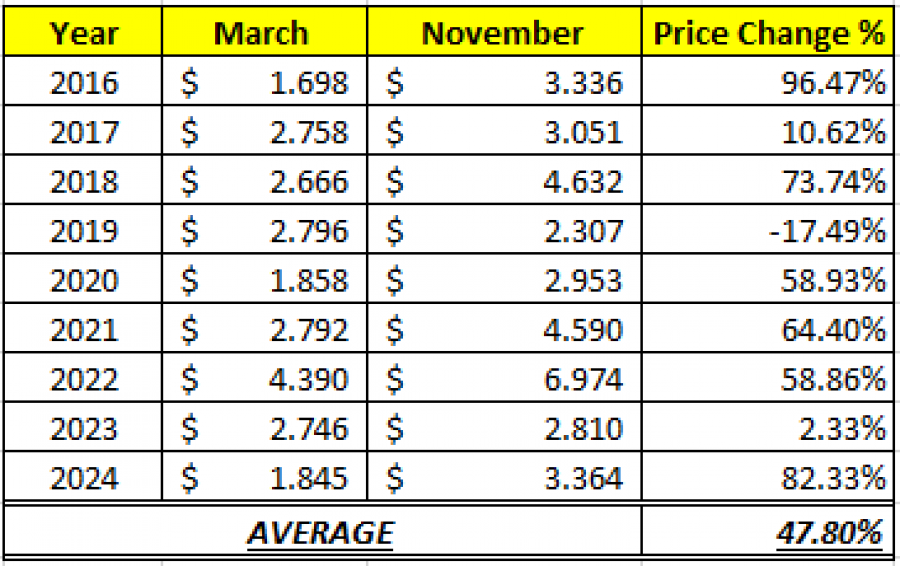
Data Source: Meta Trader 4 Platform
Please note that past performance does not guarantee future results
US NATURAL GAS
- US STOCKPILES REMAIN ABOUT 12% BELOW NORMAL LEVELS after extreme cold in January and February forced energy firms to pull massive amounts of gas out of storage, including record amounts in January.
- AROUND 40% OF ELECTRICITY IN THE U.S. IS PRODUCED FROM NATURAL GAS: Rising consumption of electricity in the US will be accompanied by rising demand for natural gas.
- U.S.A. IS ONE OF THE LARGEST EXPORTERS OF LIQUIFIED NATURAL GAS (LNG) IN THE WORLD. In total, the US exported 88.3 million tons of LNG in 2024, up 4.4% from 2023’s 84.5 million tons.
MIDDLE EAST TENSIONS:
- MAJOR NATURAL GAS SHIPPING ROUTES AT RISK AMID RISING MIDDLE EAST TENSION. Recent tensions in the Middle East have escalated risks to vital natural gas shipping routes through the Red Sea and Strait of Hormuz. The possible sinking of the Iranian Zagros by U.S. forces, Israeli airstrikes in Gaza, and Houthi attacks on U.S. warships could disrupt LNG shipments, leading to significant price fluctuations.
NATURAL GAS: PRICE ACTION
- NATURAL GAS PRICES HIT $9.972 IN AUGUST, 2022. Natural gas prices surged during Europe’s energy crisis, sparked by disrupted Russian supplies. In response, Europe increased LNG purchases from the U.S. A price movement to $9.972 would mark an around 150% difference from the current $4, though price of natural gas could also decline.
Natural Gas, March 18, 2025
Current Price: 4.00
|
NATURAL GAS |
Weekly |
|
Trend direction |
|
|
6.00 |
|
|
5.50 |
|
|
4.50 |
|
|
3.50 |
|
|
3.30 |
|
|
3.10 |
Example of calculation based on weekly trend direction for 1.00 Lot1
|
NATURAL GAS |
||||||
|
Pivot Points |
||||||
|
Profit or loss in $ |
20,000 |
15,000 |
5,000 |
-5,000 |
-7,000 |
-9,000 |
|
Profit or loss in €² |
18,321 |
13,741 |
4,580 |
-4,580 |
-6,412 |
-8,244 |
|
Profit or loss in £² |
15,429 |
11,572 |
3,857 |
-3,857 |
-5,400 |
-6,943 |
|
Profit or loss in C$² |
28,570 |
21,428 |
7,143 |
-7,143 |
-10,000 |
-12,857 |
1. 1.00 lot is equivalent of 10,000 units
2. Calculations for exchange rate used as of 12:05 (GMT) 18/03/2025
There is a possibility to use Stop-Loss and Take-Profit.
- You may wish to consider closing your position in profit, even if it is lower than the suggested one.
- Trailing stop technique could protect the profit.