Natural Gas weekly special report based on 1.00 Lot Calculation:
EUROPE IS EXPECTED TO SOON START IMPORTING BIG QUANTITIES OF NATURAL GAS
- EUROPEAN NATURAL GAS STORAGE REFILLING SEASON STARTS MARCH-APRIL AND ENDS IN NOVEMBER.
- MANDATE: EUROPEAN NATURAL GAS STORAGE MUST BE AT LEAST 90% FULL BY NOVEMBER.
- CURRENT: AT BELOW 35%.
- EUROPE IMPORTS BIG QUANTITIES OF LIQUEFIED NATURAL GAS (LNG) FROM THE USA: US supplies 50% of Europe's total LNG imports.
- 82% OF TOTAL U.S. LNG EXPORTS WENT TO EUROPE IN FEBRUARY 2024: In February, the U.S. exported 8.35 million tons of LNG. Of the total exports, 6.82 million tons (82%) went to Europe.
- EUROPE MUST INCREASE IMPORT FROM THE USA OR FACE TARIFFS ACCORDING TO US PRESIDENT TRUMP.
- STATISTICS (2016 - 2024): NATURAL GAS PRICES ROSE 18.72% ON AVERAGE AT THE START OF THE EUROPEAN REFILLING SEASON (MARCH - APRIL).
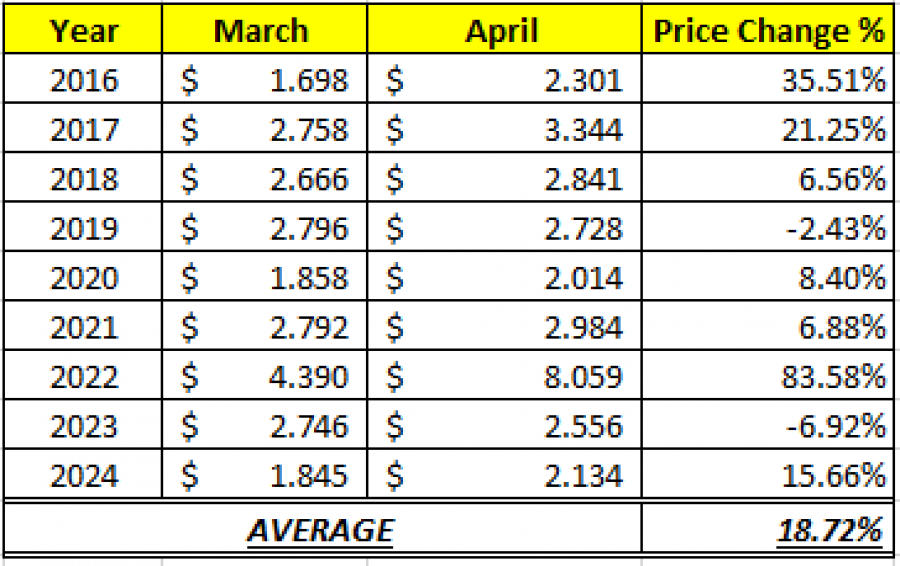
Data Source: Meta Trader 4 Platform
Please note that past performance does not guarantee future results
- STATISTICS (2016 - 2024): NATURAL GAS PRICES ROSE 47.80% ON AVERAGE DURING THE EUROPEAN REFILLING SEASON (MARCH – NOVEMBER).
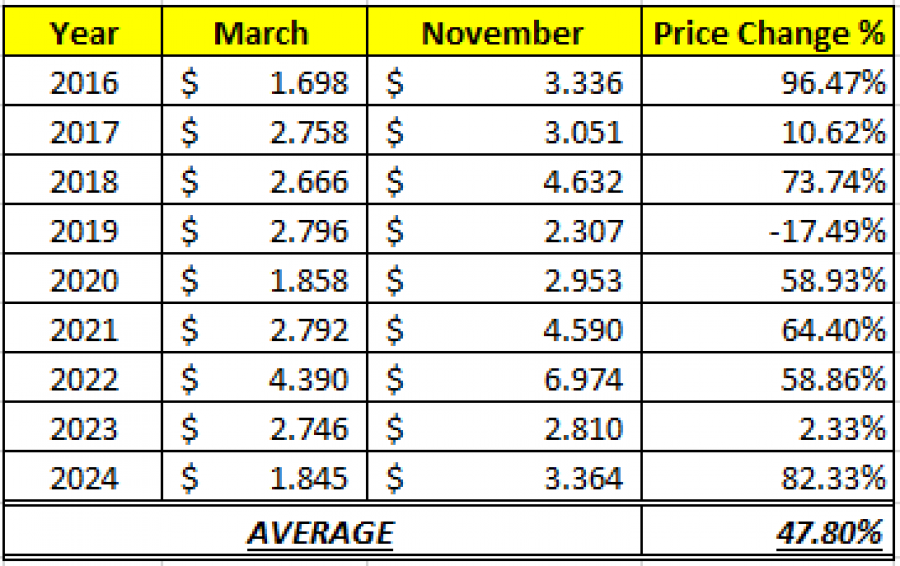
Data Source: Meta Trader 4 Platform
Please note that past performance does not guarantee future results
US NATURAL GAS
- THE US EXPORTED A RECORD AMOUNT OF LIQUEFIED NATURAL GAS (LNG) IN MARCH. According to LSEG, the US exported more than 9 million metric tons of LNG.
- AROUND 40% OF ELECTRICITY IN THE U.S. IS PRODUCED FROM NATURAL GAS: Rising consumption of electricity in the US will be accompanied by rising demand for natural gas.
- THE U.S. IS THE LARGEST EXPORTER OF LIQUEFIED NATURAL GAS (LNG) IN THE WORLD. In total, the US exported 88.3 million tons of LNG in 2024, up 4.4% from 2023’s 84.5 million tons. (Source: EIA)
MIDDLE EAST TENSIONS:
- MAJOR NATURAL GAS SHIPPING ROUTES AT RISK AMID RISING MIDDLE EAST TENSION. Rising tensions in the Middle East are threatening key natural gas routes through the Red Sea and Strait of Hormuz. A potential U.S. strike on Iran could spike global gas prices, as Iran could try to block Hormuz, a passageway for about 20% of global LNG trade. Disruptions could raise prices and energy security concerns, especially in Europe and Asia.
NATURAL GAS: PRICE ACTION
- NATURAL GAS PRICES HIT $9.972 IN AUGUST, 2022. Natural gas prices have surged amid Europe’s ongoing energy crisis, driven by reduced Russian supply that prompted increased LNG imports from the United States. Although prices have recently dipped due to negative market sentiment following President Trump’s tariffs on key trading partners, demand for American gas remains robust. A price recovery to $9.972 would mark an around 174% rise from the current $3.64, though prices could also decline.
Natural Gas, April 8, 2025
Current Price: 3.64
|
NATURAL GAS |
Weekly |
|
Trend direction |
|
|
6.00 |
|
|
5.00 |
|
|
4.10 |
|
|
3.20 |
|
|
3.00 |
|
|
2.80 |
Example of calculation based on weekly trend direction for 1.00 Lot1
|
NATURAL GAS |
||||||
|
Pivot Points |
||||||
|
Profit or loss in $ |
23,600 |
13,600 |
4,600 |
-4,400 |
-6,400 |
-8,400 |
|
Profit or loss in €² |
21,581 |
12,436 |
4,206 |
-4,024 |
-5,852 |
-7,681 |
|
Profit or loss in £² |
18,501 |
10,661 |
3,606 |
-3,449 |
-5,017 |
-6,585 |
|
Profit or loss in C$² |
33,496 |
19,303 |
6,529 |
-6,245 |
-9,084 |
-11,922 |
1. 1.00 lot is equivalent of 10,000 units
2. Calculations for exchange rate used as of 11:25 (GMT+1) 08/04/2025
There is a possibility to use Stop-Loss and Take-Profit.
- You may wish to consider closing your position in profit, even if it is lower than the suggested one.
- Trailing stop techniques could protect the profit.