Nvidia (#NVDA) Weekly Special Report based on 1 Lot Calculation:
- AI: ACCORDING TO THE INTERNATIONAL DATA CORPORATION, COMPANIES WILL SPEND $500 BILLION BY 2027, WHICH COULD SEE DEMAND FOR NVIDIA AI PROCESSING PRODUCTS: Nvidia holds around 87% of the AI Processing market as of Q2 23. Nvidia chips are a critical part in the development of artificial intelligence products.
- NVIDIA IN AI WORLD: Nvidia’s H100 GPU chip is one of the most critical tools in artificial intelligence with Nvidia the only company that produces a chip of this kind. Nvidia takes up 95% of the graphics processors used for machine learning.
The Company -
- NVIDIA develops and produces three dimensional graphics processors and other related software. Additionally, the company also produces graphics processing units, which is a critical component when developing artificial intelligence and self-driving autonomous vehicles.
Events & Analysis:
- EVENT (STOCK SPLIT: 10 TO 1): EFFECTIVE ON (MONDAY JUNE 10TH, 2024): At Nvidia’s Q1 earnings report, the company announced that it would undertake a 10-for-1 stock split, with the split effective for trading on June 10th. Generally, investors view stock splits as a sign of confidence by management, because splits happen more often in stocks that have bullish momentum. Splits also increase liquidity by making shares more accessible to a wider range of investors.
PERFORMANCE BEFORE THE STOCK SPLIT (TIME FRAME: ANNOUNCEMENT DATE TO STOCK SPLIT) (SOURCES: YahooFinance, Bloomberg, Fortrade MT4):
Apple (STOCK SPLIT: 7-1 Announcement April 23, 2014): Apple’s stock price increase around 23% from the announcement of the split until the actual execution of the split on June 9, 2014.
Tesla (STOCK SPLIT: 5-1 Announcement August 11, 2020): Tesla’s price appreciated around 60% from its announcement to the actual stock split date on the 31st of August 2020.
NVidia (STOCK SPLIT: 4-1 Announcement May 21, 2021): Nvidia witnessed a percentage price increase of around 33% between its announcement date and the effective date of the split on July 20, 2021.
*Please note that past performance does not guarantee future results
STOCK PERFORMANCE AFTER STOCK SPLIT (SOURCES: YahooFinance, Bloomberg, Fortrade MT4):
Apple (STOCK SPLIT: 7-1 effective June 9, 2014): 3 Months: +8.69%. 6 Months: +19.26%.
Tesla (STOCK SPLIT: 5-1 effective August 31, 2020): 3 Months: +28%. 6 Months: +53%.
Nvidia (STOCK SPLIT: 4-1 effective July 20, 2021): 3 Months: +17.60%. 6 Months: +30%.
*Please note that past performance does not guarantee future results
- Q1 EARNINGS PERFORMANCE –
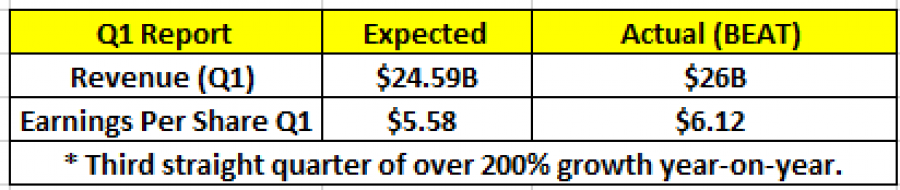
SOURCE: Bloomberg
Price Action -
- ANALYSTS OPINIONS: Rosenblatt Securities: $1400, HSBC: $1350, Evercore: $1160, Goldman Sachs: $1100
- STOCK PRICE POTENTIAL: NVIDIA was last trading at $1000, with Rosenblatt Securities targeting $1400, indicating a potential upside of ~40% should these forecasts materialize. However, the price could also decline further.
Nvidia, May 23, 2024
Current Price: 1000.00
|
NVIDIA |
Weekly |
|
Trend direction |
|
|
1500.00 |
|
|
1400.00 |
|
|
1100.00 |
|
|
910.00 |
|
|
900.00 |
|
|
890.00 |
Example of calculation base on weekly trend direction for 1.00 Lot1
|
Profit or loss in $ |
500,000.00 |
400,000.00 |
100,000.00 |
-90,000.00 |
-100,000.00 |
-110,000.00 |
|
Profit or loss in €² |
461,133.37 |
368,906.70 |
92,226.67 |
-83,004.01 |
-92,226.67 |
-101,449.34 |
|
Profit or loss in £² |
392,557.12 |
314,045.69 |
78,511.42 |
-70,660.28 |
-78,511.42 |
-86,362.57 |
|
Profit or loss in C$² |
684,075.00 |
547,260.00 |
136,815.00 |
-123,133.50 |
-136,815.00 |
-150,496.50 |
- 1.00 lot is equivalent of 1000 units
- Calculations for exchange rate used as of 09:20 (GMT+1) 23/05/2024
Fortrade recommends the use of Stop-Loss and Take-Profit, please speak to your Senior Account ManagerClient Manager regarding their use.
- You may wish to consider closing your position in profit, even if it is lower than suggested one
- Trailing stop technique can protect the profit – Ask your Senior Account ManagerClient Manager for more detail