US100 Index Weekly Special Report based on 1.00 Lot Calculation:
USA100 INDEX:
- WHAT IS A STOCK INDEX: According to Investopedia.com, a stock index measures the price performance of a basket (group) of stocks using a standardized methodology. The NASDAQ 100 Index is one of the world's best-known indexes and one of the most commonly used benchmarks for the stock market.
- COMPONENTS: USA100 includes 100 companies including Apple, Google, Nvidia, Meta, and Microsoft.
RECENT TREND:
- THE NASDAQ 100 IS NOW UP MORE THAN 80% FROM ITS OCTOBER 2022 LOWS: The Nasdaq has sharply rallied from October 2022 lows, as the tech sector continues to remain the best-performing sector in the United States. The Nasdaq rally has outpaced both the S&P500 and the Dow Jones Industrial index since October 2022.
US FEDERAL RESERVE HAS BEGUN YET ANOTHER INTEREST RATE CUT CYCLE:
- BREAKING (SEPTEMBER 18): FEDERAL RESERVE ANNOUNCED ITS FIRST INTEREST RATE CUT SINCE 2020. The US Federal Reserve decided to cut its benchmark interest rate by 0.50% points on September 18, to 5.00% from the previous 5.50%. The bank expects to cut rates two more times in 2024 to slash its benchmark rate to 4.5% by the end of 2024. The bank expects rates to fall to 3.5% in 2025 and further down to 2.9% in 2026. NEXT FED INTEREST RATE DECISION: November 7, 2024. As of October 7, the market sees a high probability rate for a 25-basis points interest rate cut. This could bring current rates of 5.00% down to 4.75%.
NEXT ECONOMIC EVENTS:
- FRIDAY, NOVEMBER 1 AT 13:30 GMT+1: NONFARM PAYROLLS AND UNEMPLOYMENT RATE (OCTOBER). U.S. job gains surged in September, marking the largest increase in six months, with nonfarm payrolls rising by 254,000—the highest since March. The unemployment rate fell to 4.1%. However, the labor market could face some short-term disruption following the devastation caused by Hurricane Helene across the U.S. Southeast. Additionally, the strike by tens of thousands of Boeing machinists in September could negatively impact October's nonfarm payroll data. The October jobs report will be published on November 1, ahead of the next FOMC meeting and the election – and could influence the outcome of both.
NEXT COMPANY EVENTS:
US STOCK MARKET: Q3 EARNINGS SEASON
- OCTOBER 11- NOVEMBER 15. The new earnings season in the US is expected to kick off with the banking sector in mid-October, while some large companies such as Tesla, Meta, Microsoft, Apple, and Amazon are expected to report their Q3 earnings results by the end of October.
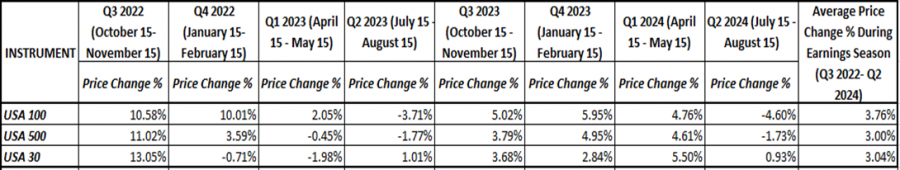
LAST EIGHT QUARTERLY EARNINGS SEASONS: THE ARTIFICIAL INTELLIGENCE (A.I.) EUPHORIA HAS CREATED ON AVERAGE A 3.76% INCREASE FOR THE USA100 DURING THE EARNINGS SEASONS. The table below illustrates price reactions of the three major US stock indices. On average, the USA100 index has risen by 3.76% each quarterly earnings season since Q3 2022. Over the same period, the USA500 index rose 3.00%, while the USA30 index climbed around 3.04%.
Data Source: MetaTrader 4 Platform
Please note that past performance does not guarantee future results
US100, October 15, 2024
Current Price: 20,600
|
USA100 |
Weekly |
|
Trend direction |
|
|
22,920 |
|
|
22,420 |
|
|
22,020 |
|
|
21,070 |
|
|
20,920 |
|
|
20,770 |
Example of calculation based on weekly trend direction for 1.00 Lot1
|
USA100 |
||||||
|
Pivot Points |
||||||
|
Profit or loss in $ |
23,200.00 |
18,200.00 |
14,200.00 |
4,700.00 |
3,200.00 |
1,700.00 |
|
Profit or loss in €² |
21,270.35 |
16,686.23 |
13,018.92 |
4,309.08 |
2,933.84 |
1,558.60 |
|
Profit or loss in £² |
17,733.27 |
13,911.45 |
10,853.99 |
3,592.52 |
2,445.97 |
1,299.42 |
|
Profit or loss in C$² |
32,056.25 |
25,147.58 |
19,620.64 |
6,494.15 |
4,421.55 |
2,348.95 |
- 1.00 lot is equivalent of 10 units
- Calculations for exchange rate used as of 12:30 (GMT+1) 15/10/2024
There is a possibility to use Stop-Loss and Take-Profit
- You may wish to consider closing your position in profit, even if it is lower than the suggested one.
- Trailing stop technique could protect the profit