USA100 Weekly Special Report based on 1.00 Lot Calculation:
USA100 INDEX:
- WHAT IS A STOCK INDEX: According to Investopedia.com, a stock index measures the price performance of a basket (group) of stocks using a standardized methodology. The NASDAQ 100 Index is one of the world's best-known indexes and one of the most commonly used benchmarks for the stock market.
- COMPONENTS: USA100 includes 100 companies including Apple, Google, Nvidia, Meta, and Microsoft.
US PRESIDENTIAL ELECTIONS (NOVEMBER 5, 2024): US STOCK MARKET TENDS TO RISE AFTER US PRESIDENTIAL ELECTIONS
- CANDIDATES: DONALD TRUMP (Republican) vs. KAMALA HARRIS (Democrat).
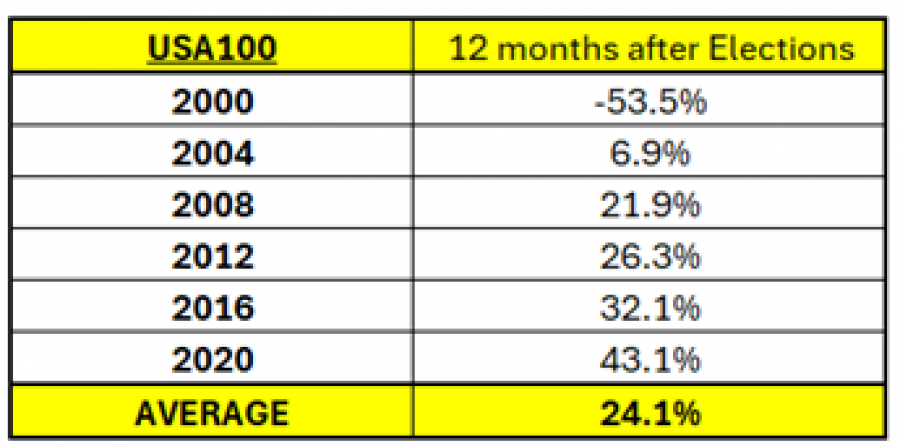
- STATISTICS (DONALD TRUMP WON IN 2016): USA100 ROSE 17.78% WITHIN 6 SIX MONTHS AND 32.07% WITHIN 12 MONTHS AFTER ELECTIONS.

Data Source: Bloomberg
Please note that past performance does not guarantee future results.
- STATISTICS (JOSEPH BIDEN WON IN 2020 WITH KAMALA HARRIS AS VICE PRESIDENT): USA100 ROSE 22.34% WITHIN 6 SIX MONTHS AND 43.13% WITHIN 12 MONTHS AFTER ELECTIONS.

Data Source: Bloomberg
Please note that past performance does not guarantee future results.
- STATISTICS (STOCK MARKET PERFORMNACE AFTER US PRESIDENTIAL ELECTIONS SINCE 2000): USA100 ROSE 24.1% ON AVERAGE WITHIN 12 MONTHS AFTER ELECTIONS. We have had 6 elections since 2000 and according to the statistics on average the US stock market could rise within the 12 months after each election. Regarding the USA100 index, a median of 24.1% increase could be noted. However, the price could decline further.

Data Source: Bloomberg
Please note that past performance does not guarantee future results.
OTHER EVENTS:
- (FRIDAY, NOVEMBER 1 AT 12:30 GMT): US NONFARM PAYROLLS (NFP) AND UNEMPLOYMENT RATE (OCTOBER)
- (THURSDAY, NOVEMBER 7 AT 18:00 GMT): FEDERAL RESERVE MEETING (INTEREST RATE DECISION)
USA100, October 29, 2024
Current Price: 20,480
|
USA100 |
Weekly |
|
Trend direction |
|
|
25,460 |
|
|
23,000 |
|
|
21,130 |
|
|
20,000 |
|
|
19,800 |
|
|
19,600 |
Example of calculation based on weekly trend direction for 1.00 Lot1
|
USA100 |
||||||
|
Pivot Points |
||||||
|
Profit or loss in $ |
49,800.00 |
25,200.00 |
6,500.00 |
-4,800.00 |
-6,800.00 |
-8,800.00 |
|
Profit or loss in €² |
46,135.03 |
23,345.44 |
6,021.64 |
-4,446.75 |
-6,299.56 |
-8,152.38 |
|
Profit or loss in £² |
38,360.69 |
19,411.43 |
5,006.92 |
-3,697.42 |
-5,238.01 |
-6,778.60 |
|
Profit or loss in C$² |
69,212.33 |
35,023.11 |
9,033.74 |
-6,671.07 |
-9,450.68 |
-12,230.29 |
- 1.00 lot is equivalent of 10 units
- Calculations for exchange rate used as of 12:30 (GMT) 29/10/2024
There is a possibility to use Stop-Loss and Take-Profit.
- You may wish to consider closing your position in profit, even if it is lower than suggested one.
- Trailing stop technique could protect the profit.