USA100 Weekly Special Report based on 1.00 Lot Calculation:
USA100 INDEX:
- WHAT IS A STOCK INDEX: According to Investopedia.com, a stock index measures the price performance of a basket (group) of stocks using a standardized methodology. The NASDAQ 100 Index is one of the world's best-known indexes and one of the most commonly used benchmarks for the stock market.
- COMPONENTS: USA100 includes 100 companies, many of them dealing with tech and A.I., such as Apple, Google, ARM, Nvidia, Meta, Microsoft, Amazon, etc.
GEOPOLITICS: US TRADE NEGOTIATIONS HAVE BEGUN
- NEWS (APRIL 9): US PRESIDENT TRUMP SUSPENDED THEIR RECIPROCAL TARIFFS ON THE REST OF THE WORLD FOR 90 DAYS. For the next 90 days, the US will charge countries that are part of the reciprocal tariff plan only 10%, compared to the range of up to 84% previously planned, as it gives time and space for other countries to begin and reach new trade deals with the USA.
- PROGRESS IN TRADE NEGOTIATIONS: US President Donald Trump has already initiated discussions with 90 countries. During the week of April 21–27, there were 14 trade meetings, and 18 trade offers received. Notably, the US and South Korea began formal talks on Thursday, April 24, and US and India have reportedly reached a deal in principle, although negotiations are still in progress.
U.S. Q1 EARNINGS SEASON (April 11 – May 15):
- USA100 INDEX COMPANIES DURING THE LAST 10 QUARTERLY EARNINGS SEASONS: 79% OF THE COMPANIES ON AVERAGE HAVE BEAT EARNINGS ESTIMATES. When a company exceeds earnings expectations, this could indicate stronger-than-anticipated performance, boosting investor confidence.
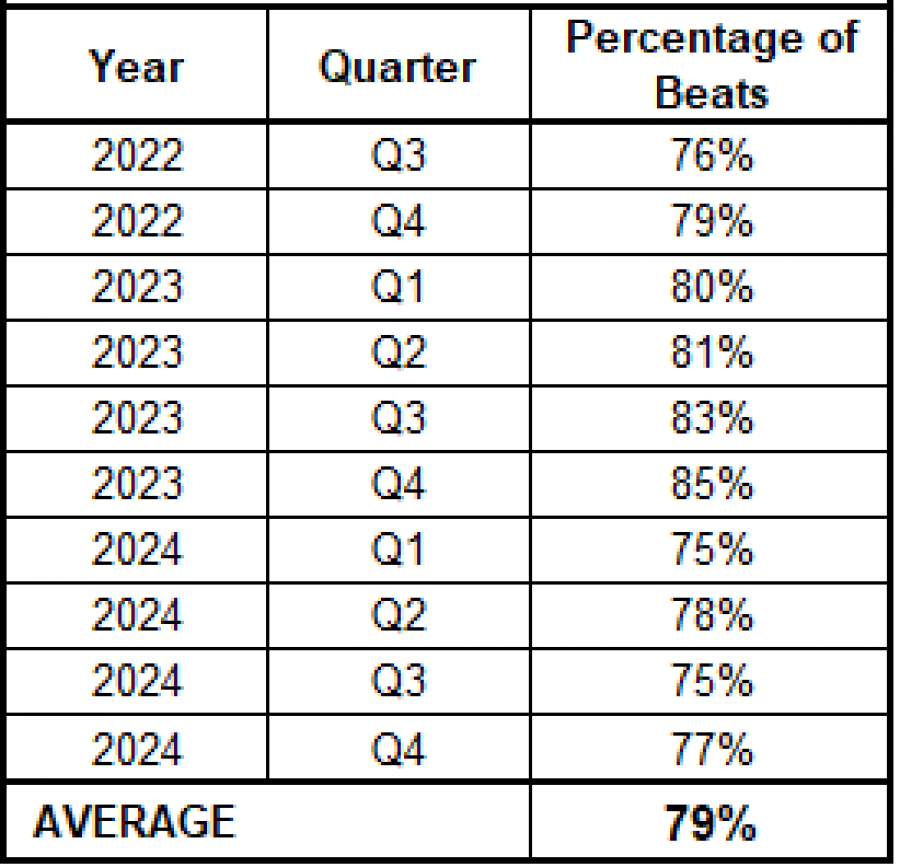
Data Source: factset.com
Please note that past performance does not guarantee future results
Q1 EARNINGS CALENDAR: Q1 Earnings Report dates for some of the most know tech companies in the world
- MICROSOFT: 30/04/2025 - AFTERMARKET
- META (FACEBOOK): 30/04/2025 – AFTERMARKET
- AMAZON: 01/05/2025 - AFTERMARKET
- APPLE: 01/05/2025 – AFTERMARKET
- PALANTIR: 05/05/2025 – AFTERMARKET
- NVIDIA: 28/05/2025 – AFTERMARKET
PRICE ACTION:
- USA100 INDEX HIT AN ALL-TIME HIGH OF 22,448.90 (DECEMBER 16, 2024). The index has traded around 19,400, and if a full recovery takes place, the price of USA100 could rise around 16%. However, the price could decline in value.
- USA100 HAS TESTED ITS LOWEST PRICE IN 15 MONTHS (16,459). The index has recently retreated from its all-time high of 22,448.90, hitting its lowest rate in 15 months, on April 6, 2025 (16,459).
USA100, April 28, 2025
Current Price: 19,400
|
USA100 |
Weekly |
|
Trend direction |
|
|
22,450 |
|
|
21,500 |
|
|
20,600 |
|
|
18,300 |
|
|
18,150 |
|
|
18,000 |
Example of calculation based on weekly trend direction for 1.00 Lot1
|
USA100 |
||||||
|
Profit or loss in $ |
30,500 |
21,000 |
12,000 |
-11,000 |
-12,500 |
-14,000 |
|
Profit or loss in €² |
26,863 |
18,496 |
10,569 |
-9,688 |
-11,009 |
-12,330 |
|
Profit or loss in £² |
22,845 |
15,730 |
8,988 |
-8,239 |
-9,363 |
-10,486 |
|
Profit or loss in C² |
42,297 |
29,123 |
16,642 |
-15,255 |
-17,335 |
-19,415 |
- 1.00 lot is equivalent of 10 units
- Calculations for exchange rate used as of 12:20 (GMT+1) 28/04/2025
There is a possibility to use Stop-Loss and Take-Profit.
- You may wish to consider closing your position in profit, even if it is lower than suggested one.
- Trailing stop technique could protect the profit.