USA30 Weekly Special Report based on 1.00 Lot Calculation:
USA30 INDEX:
- WHAT IS A STOCK INDEX: According to Investopedia.com, a stock index measures the price performance of a basket (group) of stocks using a standardized metric and methodology. The Dow Jones (USA30) is one of the world's best-known indexes and one of the most commonly used benchmarks for the stock market.
- COMPONENTS: USA30 includes 30 companies such as Amazon, Boeing, JPMorgan, Nike, Walmart, Coca-Cola, etc.
GEOPOLITICS: US PRESIDENT DONALD TRUMP OFFERS FLEXIBILITY WITH TARIFFS AHEAD OF APRIL 2
- WEDNESDAY, APRIL 2: US PRESIDENT TRUMP TO REVEAL RECIPROCAL TARIFF PLAN. The plan will include countries that will be charged higher tariffs for products they are exporting to the USA.
- RECIPROCAL TARIFF PLAN LESS SEVERE THAN PREVIOUSLY THOUGHT: According to CNBC, President Donald Trump said there will be flexibility on his reciprocal tariff plan.
- E.U. DELAYED RETALIATORY TARIFFS ON U.S. GOODS TO MID-APRIL (MARCH 20). The European Union has delayed its first countermeasures against the United States over President Donald Trump's metals tariffs until mid-April, allowing it to rethink which U.S. goods to hit and offering extra weeks for negotiations. (Source: Reuters)
- EVENT (MARCH 25-MARCH 29): U.S. - INDIA NEW TRADE DEAL TALKS. A delegation of officials from the United States will visit India from March 25-29 for trade talks with Indian officials. Assistant U.S. Trade Representative for South and Central Asia Brendan Lynch will lead the group. (Source: Reuters)
US PRESIDENT DONALD TRUMP AND HIS IMPACT ON THE US STOCK MARKET:
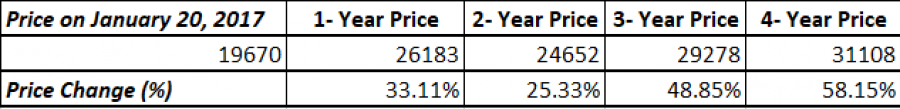
- STATISTICS (US STOCKS DURING TRUMP’S FIRST TERM (2017 – 2021)): USA30 INDEX ROSE 33.11% WITHIN THE FIRST 12 MONTHS FOLLOWING DONALD TRUMP'S INAUGURATION AS 45TH U.S. PRESIDENT (January 20, 2017 – January 20, 2018). In addition, the USA30 index rose 58.15% during the entire first term of Donald Trump’s service as 45th President of the USA.
Data Source: MetaTrader 4 Platform
Please note that past performance does not guarantee future results.
EVENTS:
- FRIDAY, MARCH 28, AT 12:30 GMT: US PERSONAL CONSUMPTION EXPENDITURES (PCE) PRICE INDEX (FEBRUARY): A fall in this index could point to the FED cutting interest rates sooner, which is supportive for silver. Data for January came in at 2.5%, down from December’s 2.6%.
- FRIDAY, APRIL 4, AT 12:30 GMT: THE US NONFARM PAYROLLS (NFP) AND UNEMPLOYMENT RATE (MARCH). The US Unemployment rose in February after a string of layoffs by Trump’s administration, which sent the unemployment rate up to 4.1% from the previous 4%. The labor market data in the US remained one of the most important reports the Fed uses in their interest rate decisions. If the labor market continued to remain under pressure, the Fed could then be expected to cut rates sooner than previously thought. This could prove positive for US stocks.
PRICE ACTION:
- USA30 HAS TESTED ITS LOWEST PRICE IN SIX MONTHS (40,706). The index has recently retreated from its all-time high of 45,224, hitting its lowest rate in 6 months on March 13, 2025 (40,706).
- USA30 INDEX HIT AN ALL-TIME HIGH OF 45,224 (JANUARY 31, 2025). The index has traded around 42,700, and if a full recovery takes place, USA30 could rise around 6%. Although, the index could decline in price as well.
USA30, March 27, 2025
Current Price:42,700
|
USA30 |
Weekly |
|
Trend direction |
|
|
45,700 |
|
|
44,700 |
|
|
43,700 |
|
|
41,800 |
|
|
41,550 |
|
|
41,300 |
Example of calculation base on weekly trend direction for 1.00 Lot1
|
USA30 |
||||||
|
Profit or loss in $ |
30,000 |
20,000 |
10,000 |
-9,000 |
-11,500 |
-14,000 |
|
Profit or loss in €² |
27,850 |
18,567 |
9,283 |
-8,355 |
-10,676 |
-12,997 |
|
Profit or loss in £² |
23,218 |
15,478 |
7,739 |
-6,965 |
-8,900 |
-10,835 |
|
Profit or loss in C$² |
42,870 |
28,580 |
14,290 |
-12,861 |
-16,433 |
-20,006 |
1. 1.00 lot is equivalent of 10 units
2. Calculations for exchange rate used as of 10:00 (GMT) 27/03/2025
There is a possibility to use Stop-Loss and Take-Profit.
- You may wish to consider closing your position in profit, even if it is lower than suggested one.
- Trailing stop technique could protect the profit.